

Founder of CX-AI.com and CEO of Success Drivers
// Pioneering Causal AI for Insights since 2001 //
Author, Speaker, Father of two, a huge Metallica fan.
Author: Frank Buckler, Ph.D.
Published on: June 29, 2021 * 7 min read
Whenever I buy a new car it happens. It happens even before I buy the car model I have in mind. Suddenly everywhere on the streets, I see this car. Suddenly everyone seems to drive it already.
The reason is a small part of your brain called the Reticular Activation System (RAS). RAS is a bundle of nerves at our brainstem that filters out “unnecessary” information so the important stuff gets through.
The RAS is the reason you learn a new word and then start hearing it everywhere. It’s why you can tune out a crowd full of talking people yet immediately snap to attention when someone says your name or something that at least sounds like it.
Get your FREE hardcopy of the “CX Insights Manifesto”
FREE for all client-side Insights professionals.
We ship your hardcopy to USA, CA, UK, GER, FR, IT, and ESP.
I once presented research where we used causal machine learning to crack that code of creatives of TV ads. It was a winning paper and presentation at the world’s largest insights conference ESOMAR. Then I presented the same at a conference full of creatives. The feedback was not very “enthusiastic”.
Why? I argued against their key beliefs and interests (they believed that the key thing is the “creative genius” outside scientific reach). Their RAS was mainly spotting what they considered as inconsistent. In short, it was not in their “interests” to believe me.
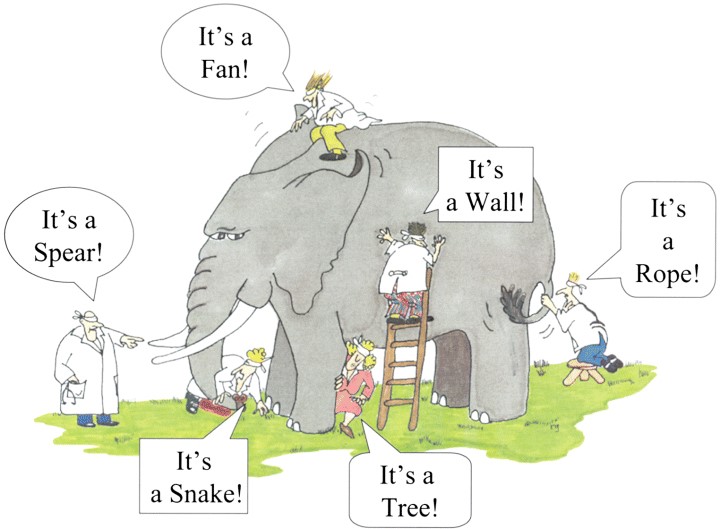
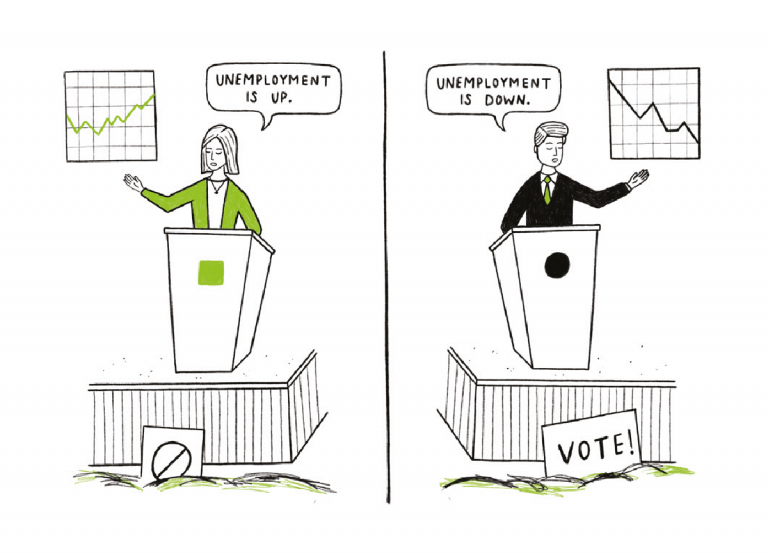
It happens all the time. Have you ever asked yourself why people have such diverging opinions e.g., about handling the pandemic?
Same thing. People have different interests. In Europe, most people are supported by the government against hardship; many of them can stay in the home office, commute less. The sacrifice and claim that a young entrepreneur feels with a working wife and two kids, while schools are closed are fundamentally different from a university professor with grown-up kids who can now save his 45min community.
Based on your interest, your RAS guides you unwillingly to information that supports your interest. Those who subjectively suffer will find reasons why the lockdown measures are not appropriate. Those who fear more the consequences of the pandemic than suffering from lockdown will consume the opposite information. The more they consume, the longer the pandemic holds, the more people become immune against counter-arguments.
That is what has happened in our society during the pandemic. The exact mechanism is in play when departments in enterprises divert.
RAS impacts how you interpret research:
2018 Kevin Heinevetter did an interesting study as a part of his bachelor thesis. He interviewed 30 customer insights leaders and gathered their unbiased pains:
A majority claimed that many research studies are commissioned just to “prove” a point the business partner wants to get evidenced. Once the survey finds the opposite, the study will “disappear” and not be brought to the attention of others.
The same happens with studies that have an unpleasant outcome. There is a tendency to change research methodology until the results fit the interest.
When presenting the same insights to different audiences, you can yield opposite reactions as described in the example of my ESOMAR presentation.
If the insights are not helpful for your interests, they are boring. If they are against their interests, they will doubt its validity.
The insight that the RAS unconsciously guides us means that all this mess is nobody’s fault, nor are managers have immoral or unethical intentions.
They have good intentions, but good intentions are not a good predictor of good outcomes. Good introspective is.
RAS impacts how you “sell” insights:
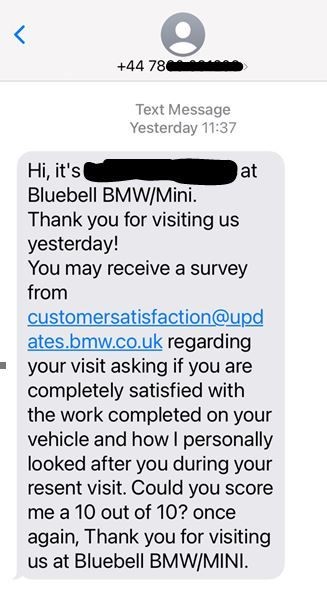
The same study from Kevin found that customer insights leaders see themselves as the guardian of truth. They enjoy being a Sherlock Holmes digging for valuable insights.
As such, they have an intrinsic interest in bringing truth to practice and having business partners appreciate it.
The good news, there are clear strategies that help overcome this.
RAS also impacts how you gain insights!
The most intuitive and most respected way of gaining insights about customers is to sit down with them, ask them open questions, and actively listen to them. It’s called “qualitative research” and it feels like everyone can and should do it.
When I started my career as a management consultant, I qualitatively interviewed many target decision-makers for our clients. Over and over again, I realized that after two or three interviews, I had a clear opinion in mind, and the following interviews, I was catching validation for those beliefs.
When you now know that his own RAS bias the interviewer, it’s now a questionable exercise. It’s not even a directionally objective collection of insights anymore. It’s a cherry-picking exercise and this article here goes deeper into why this will produce wrong insights and believes.
Actually, it’s a raffle. You don’t know what you are getting.
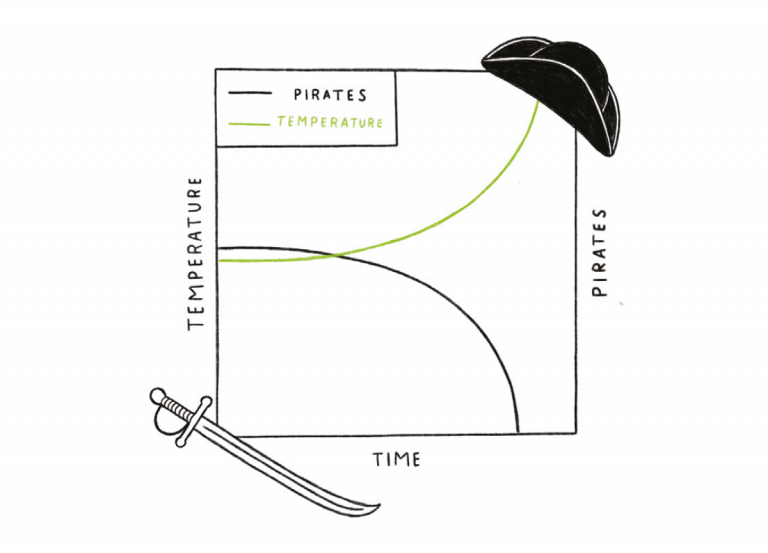
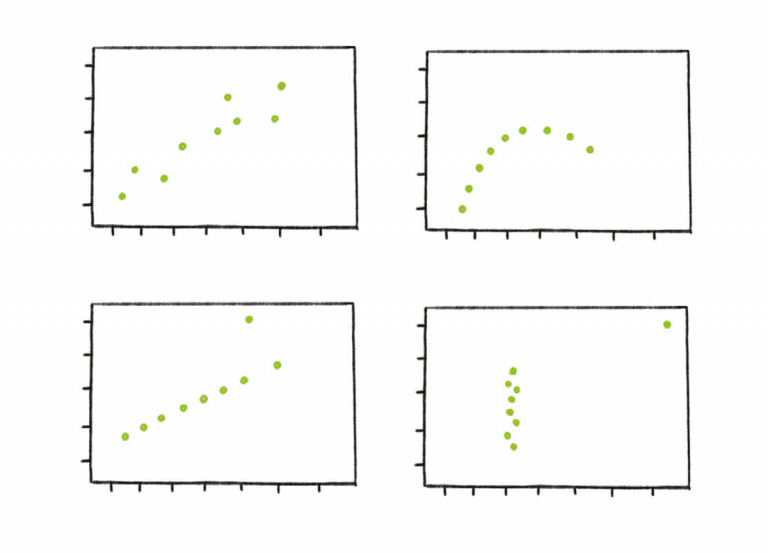
I regularly look at findings where we categorize qualitative customer response data about a why-question and trying to predict the related outcome (e.g., loyalty). Result: The verbally expressed “why” is not correlating at all with what proves to be important (evidence by predictive modeling).
In short: There is a massive mismatch between what people say and what they mean. It is naive to believe it is good enough to just to ask customers. (Spoiler: the alternative is not to not ask customers!)
Your RAS takes what you focus on and creates a filter for it. It then sifts through the data and presents only the pieces that are important to you. All of this happens without you noticing.
Your focus is defined by what’s interesting to you and what your BELIEF is.
Join the World's #1 "CX Analytics Masters" Course
Free for Enterprise “CX-INSIGHTS” Professionals
Imagine a world without mock battles, a world where everyone communicates how it feels relevant (speaks to the RAS), where people accept different interests and find ways to build bridges?
Wouldn’t our work become much more fruitful? Wouldn’t insights become much more respected? Wouldn’t insights much better resonate with business partners and thus driver impact?
There is proof that the 3 Steps that I will show you work
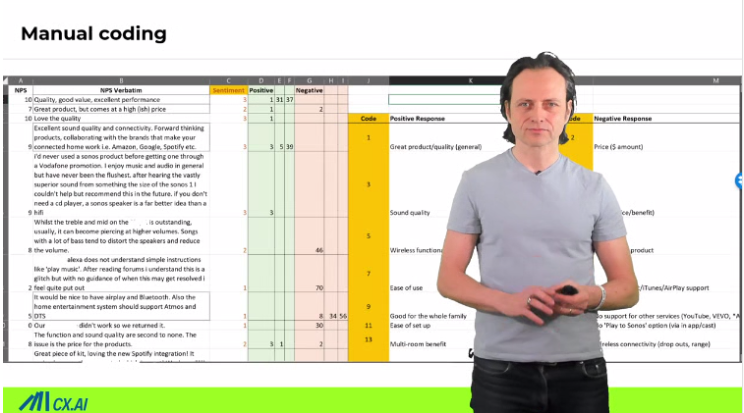
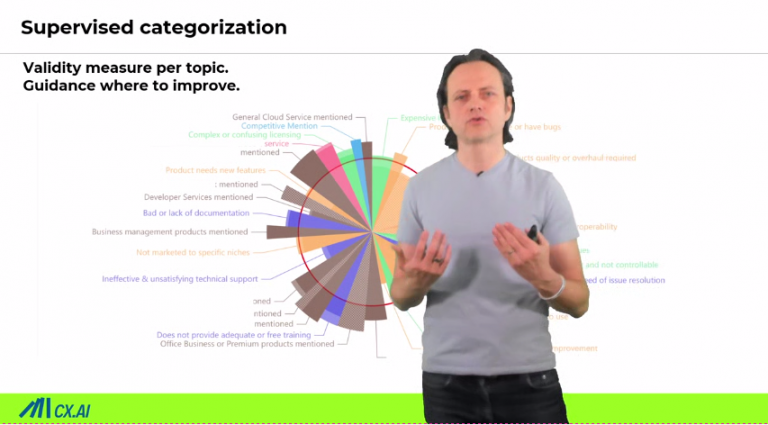
The speaker brand SONOS was historically focusing on sound quality while enabling a super easy user experience. The company is full of engineers and product designers and so their beliefs and interests.
Consequently, research data had always been taken as proof to improve sound quality further while remaining ease of use.
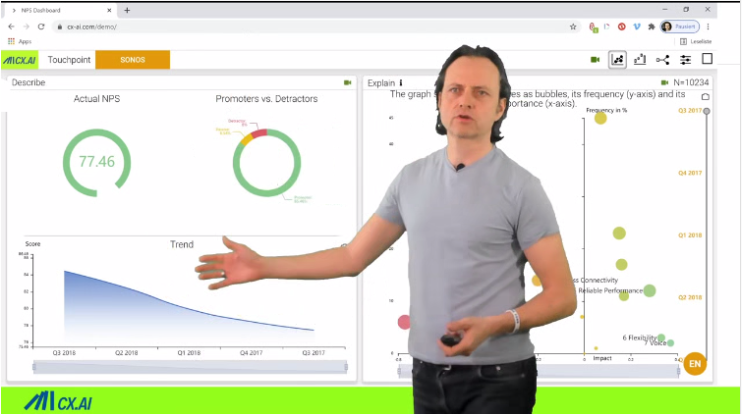
It turned out though, that despite nearly 50% of owners unprompted mentioned the “great sound” as the reason for loyalty this is not what needs to be worked on.
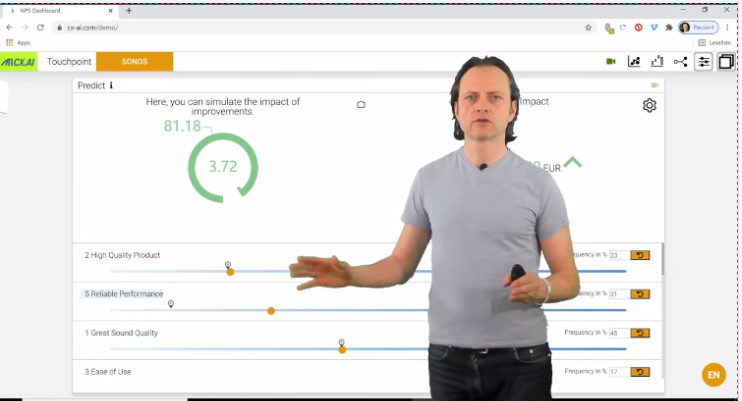
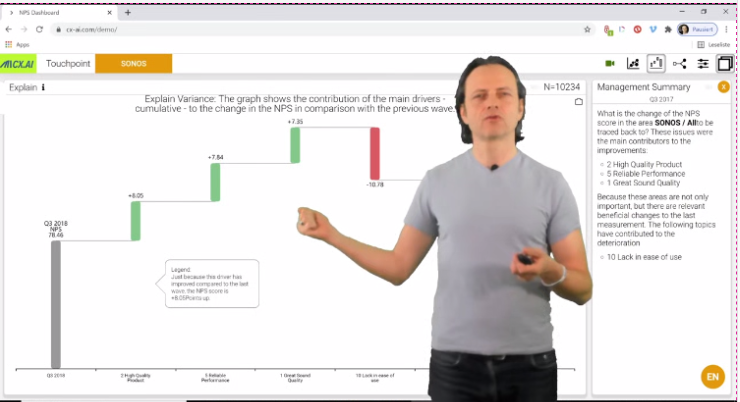
The use of causal machine-learning helps spot hidden true drivers for retention and upsell, but was the key to making predictions. Only the fiscal impact was tapping into another interest of the key decision-makers.
Suddenly research became interesting and as later the initiative resulted in higher loyalty and great sales, the reputation of the insights team skyrocket.
Keep Yourself Updated
On the Latest Indepth Thought-Leadership Articles From Frank Buckler
STEP 1: Understanding interests
It starts with understanding: understanding your own interest, understanding interviewers’ interests, understanding your business partners’ interests. We are all humans, don’t judge, just honestly assess interests, hopes and fears. Nobody can ever be objective.
“The shoemaker has the worst shoes” is a German saying. With this, insights leaders must research on their behalf to successfully “sell” the truth. This helps not only the business but also insights leaders’ career.
Insights leaders should know themselves best which methods to use. In doubt, do some simple IDI’s (in-depth interview).
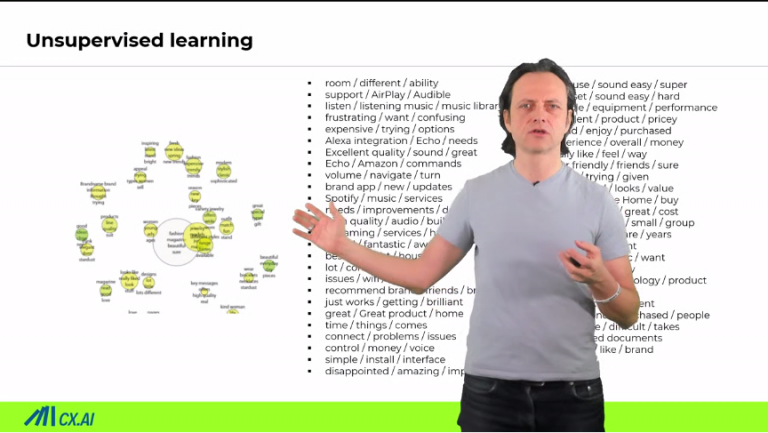
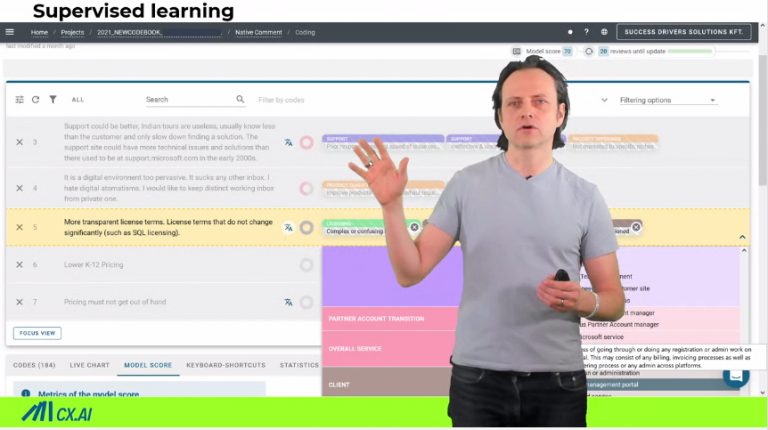
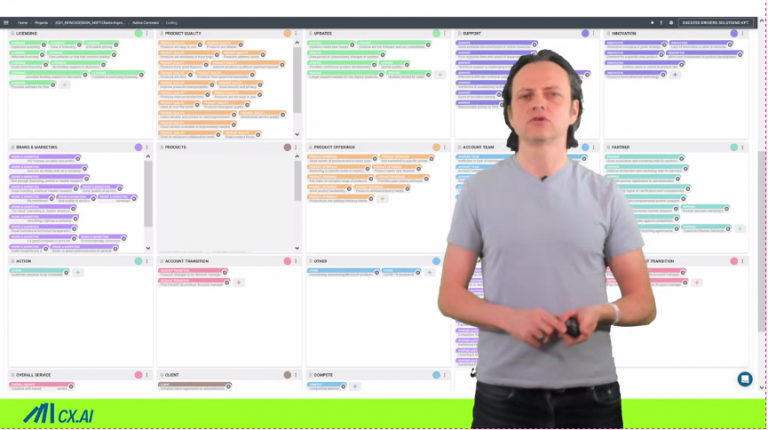
STEP 2. Unearth unbiased truth
It’s hard to convince others if you have your own agenda. It’s hard to convince others when it’s evident that interpreting or even interviewing is a highly biased process.
The solution is to set yourself up to the highest standards of insights: the ambition to find causal root causes of success.
Methods to perform this are causal modeling techniques. They are hardly used because legacy methods have severe restrictions and unrealistic assumptions. With the advent of Causal Machine-Learning, this is over. Read here on all the background
With causal machine learning, you are not bound to just quantitative analysis. You can suddenly quantify the impact of qualitative topics mentioned in open-ends. It has the power to convert “the raffle of qual research” into a science.
STEP 3: Align results with interest
If you know the business partners interest and you’ve uncovered hidden truth, then its time to align results with business partners’ interests.
Research results need to start with a summary on how results will be helpful for the business partner. “Useful” needs to be so tangible that the business partner can feel it serves their personal interests, pains, hopes, and fears.
A good trick is also to ask business partners before presenting results, “What results do you expect?”, “If a finding result is not plausible to you, what is needed to make you still buy into the results?”
We all live in this illusion that our rational brain makes decisions and that our perception is surfacing objective facts. If everyone in the room has read this very article – it will further accommodate the discussion and lead to productive compromises.
Being open, honest, and transparent are the best ways to avoid fruitless fights and to win together.
The Reticular Activation System (RAS) is a highly effective human-inbuild filter mechanism that unconsciously scanned millions of information we are exposed to bring to our attention that predictably serves the individual’s needs.
While this is effective for survival in a stone-age setting, it can be counterproductive in the corporate world.
Everything is largely biased. What we learn is based on a biased sample. This fact produces in its tendency wrong knowledge (for details, see this article).
Research is biased, as well as decision-making. It’s worthwhile to overcome it. The 3 STEPS are here to help:
STEP 1: Understanding interests
STEP 2. Unearth unbiased truth
STEP 3: Align results with interest
While implementing Step 1 and 3 is a highly individual exercise, Step 2 is not.
For CX Insights, standardized, widely used methods provide the unbiased hidden truth that gives businesses validity, focus, and finally prosperity.
My colleague Claire offers weekly some Strategy Sessions for Enterprise Insights Leaders, and you can book your time with her to inform yourself on how you can up your insights game.
"CX Standpoint" Newsletter

Each month I share a well-researched standpoint around CX, Insights and Analytics in my newsletter.
+4000 insights professionals read this bi-weekly for a reason.
I’d love you to join.


“It’s short, sweet, and practical.”


