CX.AI -Experience the new generation of CX Insights

All Posts By

Lilla Szücs

Representativeness: How AI can lead us out of the mess

Representativeness:

How AI can lead us out of the mess

Founder of CX-AI.com and CEO of Success Drivers
// Pioneering Causal AI for Insights since 2001 //
Author, Speaker, Father of two, a huge Metallica fan.

Author: Frank Buckler, Ph.D.
Published on: November 9, 2023 * 5 min read

If you ask journalists what makes a representative survey, you often hear: it needs at least 1,000 respondents. This makes experienced market researchers smile. They know that representativeness has absolutely nothing to do with the sample size. There is no simple answer to the question of how to obtain representative studies. Not yet.

How do you know that a sample is representative? Simply check whether the demographics look like the statistics from the residents’ registration office. That sounds simple. Good luck with it! 

You need a large number of respondents to obtain stable results. A representative sample, on the other hand, is needed to obtain truthful results. Stable and true are two independent characteristics. While stability is easy to establish, representativeness often gives market researchers gray hair.

Let’s assume that 100 people are surveyed. In line with official statistics, 20 percent of the sample are young people, and 20 percent are high earners. But now it may be that (for whatever reason) the 20 young people are also high earners, which would not be representative at all. Admittedly, this is an extreme example. It is only intended to illustrate: Quotas based on demographic characteristics are a blunt sword when it comes to ensuring representativeness.

But it gets even trickier. In many cases, it makes no sense at all to focus on demographics. If, for example, you want to measure a political opinion or the propensity to buy an electric car, then it is crucial that the sample is representative of the types of values prevalent in the population. This usually correlates only moderately with pure demographics.

“Ok, then I’ll use the value types” is what comes to mind. Sure, you can query value types in the screener and try to weight the evaluation according to a hopefully known distribution.

But there are two catches: firstly, I need to know what influences my desired metric for political opinion or the propensity to buy an electric car, for example. Only then can I manage this type of representativeness in advance. Secondly, I need to know the distribution of these hopefully known, moderating influences in the population.

In short, representativeness is almost impossible to control for practical market research. It’s a bit like flying blind.

The influences on representativeness are different in every study and are usually little known. Their distribution in the population is also unclear. And as a further point, I cannot ensure that the multidimensional distribution (= cross-distribution of different dimensions) is correct.

Get your FREE hardcopy of the “CX Insights Manifesto”

FREE for all client-side Insights professionals.
We ship your hardcopy to USA, CA, UK, GER, FR, IT, and ESP.

What now?

You bet… how about AI? Here is a four-step plan that was created entirely without AI

  1. Measure the representativeness drivers

You should think in advance about which aspects could influence the key metric. The emphasis is on “could”, because we often don’t know exactly. The idea is to cast a wide net and then, in step two, look at this wide net to see what actually has a significant influence. These aspects are then added to the questionnaire.

  1. Modeling with Causal AI

Now we calculate a flexible driver model (ideally with Causal AI) and find out whether part of the variance in the target variable(s) of the study can be predicted by the representativeness drivers. If so, it is important to manage representativeness in these variables. We are interested here in the effect size of the representativeness drivers, not the effect size. In the case of non-linearities or interactions, there is a big difference here.

  1. Ground truth

The search for other representative studies can help to find the right population for the relevant representativeness drivers. Alternatively, you can also try to derive or triangulate plausible values from secondary sources. In case of doubt, data from expert opinions or prompting a LLM is better than nothing.

  1. Shortcut: Simulate with AI

With the help of the driver model from 2. and the ground truth information, the target value distorted by the non-representative sample can be corrected. All you have to do is change the measured values of the representativeness drivers in the data set to correspond to the ground truth information. The driver model uses these correlated corrected values to calculate a target value that is closer to the truth.

  1. Simulate virtual respondents with AI

The shortcut corrects the distribution of a variable, but it does not solve the problem of multivariable maldistribution (= incorrect cross-distribution of variables). This can only be solved with the help of a representative base sample. By a representative base sample, I mean a sample that is collected using random routes and face-to-face interviews and stratification by area. The variables that the base sample has in common with the current study can now be used in the model of 2. The comparison with the current sample can measure the bias effect, and thus, this bias can be eliminated. There is not enough space here to describe this procedure in detail.

Join the World's #1 "CX Analytics Masters" Course

How do we do this in concrete terms?

Jenni Romaniuk, Associate Director of the Ehrenberg-Bass Institute, said in her keynote speech at the planung&analyse Insights conference in Frankfurt: “Don’t set quotas for demographics but for past brand usage”. The first rethink must, therefore, take place when recognizing the drivers of representativeness.

Our experience from hundreds of causal driver analyses also shows this: Demographics often show no or only moderate influence. Composing a sample with people who have very different levels of experience with a brand can completely distort the results.

Keep Yourself Updated

On the Latest Indepth Thought-Leadership Articles From Frank Buckler

My take-away

Companies and market researchers need results they can trust. That’s why they make sure that the panel quality is right and that the data is collected in a “reasonably” representative way. We have just explained how difficult this is. A certain resignation has already crept into the industry. 

This is not necessary. At Microsoft, for example, we were able to accompany a process in which the global customer satisfaction surveys are viewed in such a way that the key figures are comparable between different waves and fluctuate less. Previously, key figures for segments and markets were only reported from a sample of N=100. Today, N=50 is sufficient. We were able to show in studies that the recalibrated values are closer to the truth than the raw data with a smaller sample size.

We therefore recommend systematically monitoring the representativeness drivers of the studies with flexible causal AI driver models – i.e. not with conventional multivariate statistics. An automated analysis process would be desirable. Not every company has the capacity that Microsoft does. Perhaps an innovative start-up will soon be found to tackle the issue. 

Who knows? Your thoughts?

"CX Standpoint" Newsletter

Each month I share a well-researched standpoint around CX, Insights and Analytics in my newsletter.

+4000 insights professionals read this bi-weekly for a reason.

I’d love you to join.

“It’s short, sweet, and practical.”

[wpforms id="4082"]

Big Love to All Our Readers Around the World

The future of significance

“Is it significant?” is the wrong question

Founder of CX-AI.com and CEO of Success Drivers
// Pioneering Causal AI for Insights since 2001 //
Author, Speaker, Father of two, a huge Metallica fan.

Author: Frank Buckler, Ph.D.
Published on: October 6, 2023 * 8 min read

The other day I noticed a post on LinkedIN by an esteemed acquaintance, Ed Rigdon, Professor at Georgia State University in Atlanta USA. I read, “Even though significance tests date back only to the 1930s when Fisher promoted them, and even though they are logically flawed and clearly retard knowledge growth, social science researchers are enslaved by this very bad idea. Even now that the American Statistical Association has explicitly rejected the concept, researchers cling to it desperately.”

Photo: Thomas Fedra

Wow. Tough stuff. Can that be true? In business, when you look at market research and analysis results, two questions often come up: is this representative and is this significant? In other words, “is it true for everyone” and “is the impact large”? If we ignore representativeness today, it is common practice – both in science and in companies – to answer with the P-value. It is also known as significance value or probability of error. With 0.001 the P-value is really good and in practice sometimes even 0.1 is accepted as sufficient. The significance is used as a judge between right and wrong.

I look at the official statement of the American Statistical Association on the P-value:

  • Principle 1: P-values can indicate whether data are inconsistent with a particular statistical model.

  • Principle 2: P values do not measure the probability that the hypothesis under study is true or the probability that the data are due to chance alone.

  • Principle 3: Scientific conclusions and business or policy decisions should not be based solely on whether a P value exceeds a certain threshold.

  • Principle 4: Proper conclusions require full reporting and transparency.

  • Principle 5: A P value or statistical significance is not a measure of the size of an effect or the significance of a result.

  • Principle 6: A P value alone is not a good measure of evidence for a model or hypothesis.

There now seems to be a scientific consensus in the American Statistical Association that the practice of using significance values is not very useful, if not dangerous. Why dangerous? Because it declares relationships to be “true” that, when viewed holistically, are not. Therefore, wrong decisions and low ROI are preprogrammed for the practice. Read here.

Get your FREE hardcopy of the “CX Insights Manifesto”

FREE for all client-side Insights professionals.
We ship your hardcopy to USA, CA, UK, GER, FR, IT, and ESP.

Significance can be created arbitrarily

Language usage is a bad advisor. We all know sentences like “Mr. Y had a significant impact on X”. What is meant here is “great” or “significant.” But if something is statistically significant, it does not mean that it must be significant. On the contrary, something statistically significant can also be very small and insignificant. What is significant is that a correlation between data is so clear that it is not based on chance.

In market research parlance, significant is thus “proven to be true.” But nothing is set in stone. In science, the term “p-hacking” has emerged. Models, hypotheses and data are changed and trimmed until the P-value is below the targeted threshold. If “P-hacking” is already commonplace in science, what does it look like in market research practice?

Significance has nothing to do with relevance

In practice, just about any correlation becomes significant if only the sample is large enough. Significance does not measure how strong a correlation is, but whether it can be assumed to be true or present.

A strong correlation usually needs a smaller sample to become significant. This phenomenon often leads to the misunderstanding that significance also measures relevance. This is not the case. Every Swabian is a German but not every German is a Swabian. So a minimal effect can be significant. But all this is clear to many market researchers. The real problem lies elsewhere:

Join the World's #1 "CX Analytics Masters" Course

Significance in itself says nothing

Who doesn’t know them, the harebrained examples of correlation like the one between the “age of Miss America of a year” and the “number of murders with steam or other hot objects”. At N=8 years, this statistic already has a P-value of 0.001.

Correlation is not causation

An example could not be clearer to show how unsuitable the P-value is for testing a correlation for its truth. But why is it still used as a judge of right or wrong? The answer is many and varied.

Some will say “the customer wants it that way”. But the more relevant question is: How does right go? How can I find out if a context is to be trusted?

To answer that, let’s revisit the P-value used to assess: The P-value wants to judge differences found OR correlations found.

Questions about differences are: “Do more customers buy product X or Y”. The result of a survey gives two results, which are then compared. A comparison using a significance test is limited if:

  1. Representativeness is limited.

If a smartphone brand surveys only young people, the result will not reflect that of the entire population because older people have different needs. If the sample does not represent the population well, the results will not be accurate. However, only characteristics of the people that have an influence (see context) on the measurement result are relevant. This is exactly the point that is usually overlooked. It is practical to quote only by age and gender without checking whether these are the relevant representativeness drivers.

  1. The measurement is biased.

I can ask consumers “would you buy this cell phone”. But whether the answer is then true (i.e., unbiased) is another matter. A central focus of marketing research in recent years has been to develop valid scales. Implicit measurement methods have been added more recently. The art of questionnaire design is one of them.

Questions on correlations, on the other hand, are: “Do customers in the target group buy my product more than other target groups”. Behind this is the assumption that the target group characteristic is causal for the purchase. A connection is assumed between consumer characteristics and willingness to buy. It is no longer merely a matter of showing the difference between target groups, because this would be tantamount to a corellation analysis, which is known to be a poor form of analysis for correlations, as the example above shows. In my opinion, the question of correlations is not discussed enough, although it has a very special meaning.

The Evidence Score

The vague term “context” is about something very concrete: a causal effect relationship. All business decisions are based on it. They are based on assumptions about causal impact relationships. “If I do X, then Y will happen”. Discovering, exploring and validating these “relationships” is what (consciously or unconsciously) most market research is about.

But whether we can trust a statement about a context is indicated by the product of the following three criteria:

Completeness (C for Complete): How many other possible reasons and conditions are there that also have an influence on the target variable, but have not been considered in the analysis so far. One can express this with a subjective probability (an a priori probability in the Bayesian sense): 0.8 for “pretty complete”, rather 0.2 for “actually most of it is missing”, or 0.5 “the most important is in there”).

But why is completeness so important? Example: shoe size has some predictive power for career success because, for various reasons, men climb the career ladder higher on average and have larger feet. If one does not include gender in the analysis, there is a great risk of falling for spurious effects. Causal researchers call this “the confounder problem.” Confounders are unconsidered variables that influence cause and effect at the same time. Even today, most driver models are calculated with “only a handful” of variables, and the risk of spurious findings is therefore high.

The issue of representativeness logically belongs to completeness. This is because one either ensures a representative sample (which is more or less impossible) and controls for biasing factors, or one measures the factors that influence the relationships being measured (demographics, shopper types, etc.) and integrates them into the multivariable analysis of the relationships. I’ll go into this topic in detail once in another post (tentative title: “AI saves representativeness”).

Correct Direction of Action (D for Directed correctly): How sure can we be that A is cause of B and not vice versa? There one can often fall back on previous knowledge, possibly one has longitudinal data. Otherwise statistical methods of “d-separation” (e.g. PC-algorithm) have to be applied. So again it is about the questions how the subjective probability is: rather 0.9 for “well, that is well documented” or 0.5 for “well, that could be so or so”?

Predictive Power (P for Prognostic): How much variance in the effected variable does the cause explain? Measures of effect size measure the absolute proportion of the variance explained that is made possible by a variable. Nobel Prize winner G. Granger once stated in his research: In a complete (C), properly directed (D) model, the explanatory power of a variable proves its direct causal influence.

If any of the three variables C, D or P hapens, the evidence for the relationship is very thin. This is because all three aspects are interdependent. Prognostic power without completeness or the right direction is worthless.

Mathematically, all three values can be multiplicatively combined. If one is small, the product is very small:

Evidence = C x D x P

This Evidence is a proven tool in Bayesian information theory, as well as a viable and useful value for making a judgment for a context.

Keep Yourself Updated

On the Latest Indepth Thought-Leadership Articles From Frank Buckler

Moving away from black-and-white thinking

If the evidence is high, then … yes, then one may ask again: what is the significance value of the correlation? But this is not about reaching a threshold value because the P-value cannot be the only criterion for whether one recognizes a finding. The P-value as a continuous measure is more informative and tells us how stable the statement we have in mind is. Nothing more. But no less, either.

Ed writes again...

I’m back on LinkedIn and re-reading a post by Ed Rigdon introducing his paper on the topic. He writes:

“How about just treating P-values as the continuous quantities they are? Don’t allow an arbitrary threshold to turn your P value into something else, and don’t misinterpret it. And while you’re at it, remember that your statistical analysis probably missed a lot of uncertainty, which means your confidence intervals are probably way too narrow.”

The next time a client asks me what the P-value is, I tell them, “I don’t recommend they look at the P-value when it comes to trustworthiness. We measure the evidence score these days. Ours is 0.5, and the last model’s based on which you made a decision at high significance was only 0.2.”


LITERATURE

[1] “How improper dichotomization and the misrepresentation of uncertainty undermine social science research,” Edgar Rigdon, Journal of Business Research, Volume 165, October 2023, 114086.

[2] “The American Statistical Association statement on P-values explained,” Lakshmi Narayana Yaddanapudi, https://www.ncbi.nlm.nih.gov/pmc/articles/PMC5187603/

"CX Standpoint" Newsletter

Each month I share a well-researched standpoint around CX, Insights and Analytics in my newsletter.

+4000 insights professionals read this bi-weekly for a reason.

I’d love you to join.

“It’s short, sweet, and practical.”

[wpforms id="4082"]

Big Love to All Our Readers Around the World

Synthetic market research – Does it make sense?

Synthetic market research -

Does it make sense?

Founder of CX-AI.com and CEO of Success Drivers
// Pioneering Causal AI for Insights since 2001 //
Author, Speaker, Father of two, a huge Metallica fan.

Author: Frank Buckler, Ph.D.
Published on: September 11, 2023 * 7 min read

One speaks of synthetic market research when market research results are obtained purely from generative AI. But how can this be done? How is AI supposed to know what consumers are thinking here and now?

It is totally illogical. But what is useful is right. And so maybe it makes sense to take a closer look at the whole thing.

When I hear experts write about generative AI, people seem to divide into two camps. Those who are euphoric about the benefits of the new technology and then extrapolate this too euphorically into the future. 

The other camp, while open to the use of technology (because the benefits within certain limits are obvious and no longer disputable), are downright happy to see any evidence of why technology is not as good as humans and existing techniques, and argue why this will remain so forever.

As always, the truth lies in the middle. Both the critical and the visionary mindset are needed. But according to Steve Jobs, only those who are “stupid” enough to think that this is impossible for a long time will change the world. 

Logical, actually. If I assume that LLMs cannot replace market research, I will not be able to find out how and under which circumstances they might.

Get your FREE hardcopy of the “CX Insights Manifesto”

FREE for all client-side Insights professionals.
We ship your hardcopy to USA, CA, UK, GER, FR, IT, and ESP.

There are interesting examples

Earlier this year, a scientific paper by Harvard researchers made headlines. They used GPT3 and simulated the toothpaste purchasing process to find out what the price discount function looks like for different brands. Surprisingly, the results were quite close to conjoint measurement results

In February, another amazing study appeared in the Journal of Political Science in which GPT3 can be used to reproduce the results of political polls. I quote from the summary:

“We then compare the silicon and human samples to demonstrate that the information contained in GPT-3 goes far beyond surface similarity. It is nuanced, multifaceted, and reflects the complex interplay between ideas, attitudes, and sociocultural context that characterize human attitudes. We suggest that language models with sufficient algorithmic fidelity thus constitute a novel and powerful tool to advance understanding of humans and society across a variety of disciplines.”

In May, Steffen Schmidt from the Swiss LINK surprised with the use of an AgentGPT system that appreciated the price discounting function of the APPLE VISION PRO. The system takes a multi-step approach and first researches competitor prices, then promotes itself.

We at Success Drivers then tried to validate this in June by comparing the results with a “real” measurement of the price sales function using the Implicit Price Intelligence method (see Planning&Analysis issue 1/2023). Result: the resulting price-sales function differs, but the resulting optimal price is not that far from optimal. Simpler methods like Garbor Granger or Von-Westendorp would have been worse.

Kantar published a study on the use of synthetic market research in July and came to mixed conclusions. In essence, the researchers are trying to report the results of Likert scales. This works very well in some cases, not so well in others. In some cases, the researchers find strong demographic biases in the LLMs.

This can not work at all

But there is also no shortage of critical articles. 

Something to the effect of Gordon Guthries attempt to examine the reliability of the LLM by analyzing rare events. He and others see three fundamental weaknesses of the LLM (and leave their analysis at that)

  1. LLMs do not store structured knowledge as we know it. They store associations and are always in danger of being inconsistent.

  2. LLMs have simply been fed by available information and are not a representative reflection of reality. The availability of this information is an extreme bias. Thus, the output is also determined by unknown biases. As a corrective, there is the feedback mechanism from which the AI learns to “get better”. Unfortunately, the feedback is also not representative.

  3. LLMs provide easy-to-read results and create the illusion of truth. Like complex Barnum phrases, they sound reasonable but may be inane.

This analysis is good and correct. But we will only find out if and how we can use the technology, if we consider it possible to use the technology -sensibly tamed or further developed-.

So I think about how the mind of a human being is knitted and I notice that it is quite similar to the mind of the LLM.

  1. People store knowledge through associations. Knowledge is not immediately stored in the brain in a structured way. The structuring is a performance that takes place afterwards, for example through external or internal illustrations/visualization. This is exactly why LLMs can also reproduce the answers of people very well.

  2. People’s knowledge is fed by extremely distorted information. The simplest proof of the thesis are our media which consist to 90% of negative information, whereby the reality consists of predominantly positive events. Also independently of this it is to be assumed that no matter what we “know” – and that includes straight also expert with one – is extremely distorted, simply because the sampling of the information we take up is distorted. Every market researcher knows the relevance. How can I find out the truth if the information is not representative?

  3. People provide well understandable, plausible feedback. But whether what they say reflects their inner truth is not apparent from the answer – plausibility is NOT proof of truth. It is not even a necessary condition.

A nice example is this one. What does AI answer to these questions?:

  • The professor married the student because she was pregnant. Who was pregnant?

  • The student married the professor because she was pregnant. Who was pregnant?

The AI answers the way humans intuitively answer: “the student”. This answer is not politically correct nor logically unambiguous. But it is the probabilistically best answer based on the data we have learned. 

The word “professor” is associated with “masculinity. We want to change that as a society, but that’s another story. The fact is that the human association is still also closer to reality.

The AI responds as a human would with its learned associations. 

Join the World's #1 "CX Analytics Masters" Course

What does this mean for synthetic market research?

I conclude three theses from this:

THESIS 1 – Interviewing AI is similar to interviewing an individual human. It is not a database or structured knowledge. Think of the output of the AI as just ONE “opinions”.

THESIS 2 – We can simulate a representative survey if we ask (prompt) the AI to take the view of a specific human and run this for all variants of different consumers. These consumers can be described by his demographics, experiences, personality or values.

KASTEN: What’s interesting is that we have the chance to get more representative results than in real market research. Why? If I want to have 50% men and 50% East Germans in the sample, it can happen that in extreme cases all men come from East Germany. In other words: A necessary “multi-dimensional quotation” hardly ever takes place in market research practice for practical and cost reasons. But it is necessary in order to really ensure representativeness. In synthetic market research, this is simple, fast and free of charge. Of course, I need to know the actual distribution of the characteristics in reality, which will usually not be the case.

THESIS 3 Validation is necessary: The following applies to synthetic market research (which should also apply to “real” horny): We cannot assume that market research results are correct unless we have validated them with other independent information.

Would you like an example?

Classic market research always produces results. But whether this can be taken at face value without reflection is another matter.

What are the validation methods? I can think of these three:

  1. Ask a related question whose answer should be consistent with the first: As seen in the example above, a contradiction indicates that at least one of the two answers cannot be readily accepted.

  2. Comparison with other data sources: Is it possible to formulate an initial hypothesis from other sources? 

  3. Predictive information: Ask LLMs how products perform in the market on the important criteria according to customer opinion. Then calculate a multiple regression (in the simplest case) on market share. If a high coefficient of determination (R2) can be achieved, the LLM has done a good job. In other words, if a piece of information can help predict an outcome, then it is no longer random, but has valuable information in it and is also valid (apart from scaling).    

That is too risky for me

Why would a company take the risk of doing synthetic market research when you can buy a solid, real sample for a few hundred or thousand dollars?

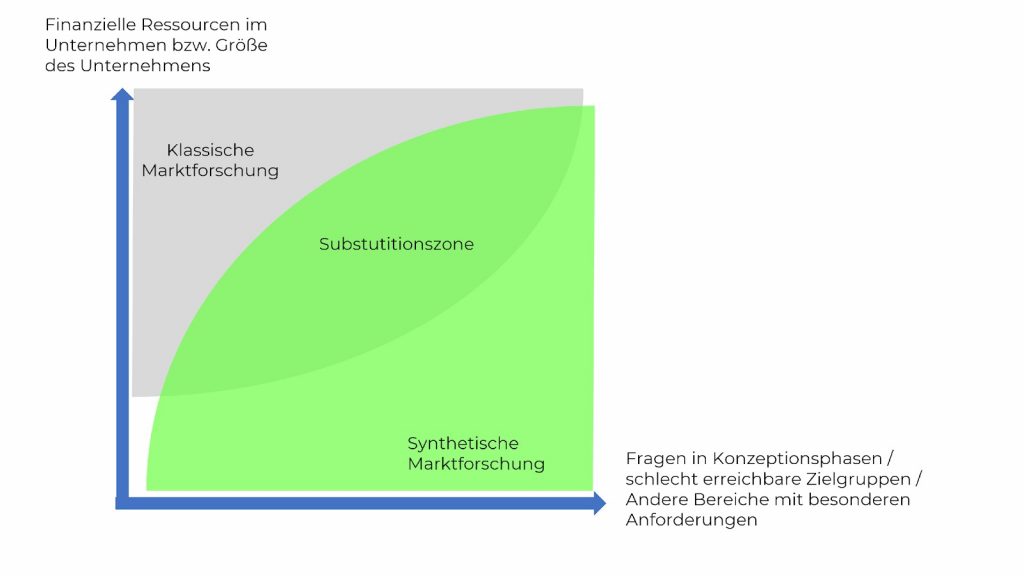
A fair question: indeed, I suspect that synthetic market research is not a substitute for most of current market research practice. 

But how often are there information needs in companies that are not covered by market research because it is too expensive and takes too long? Most decisions today are made on the basis of expert assessments, a few qualitative interviews and desktop research, and not on the basis of market research. Especially when you consider that about 50% of our economic value is created by companies with less than 50 million in sales. 

Today, half of the economy hardly does professional market research. This raises the question of whether synthetic market research can complement and improve expert opinions, “self-service SurveyMonkey”, a few qualitative interviews or desktop research.

There are also several phases in the insight process of large companies. It starts with a qualitative phase and the quantitative phase, in which investment is made in market research, only begins once the options space has been narrowed down.

Especially in the preliminary phase, it can make a lot of sense to use synthetic market research. Because it can complement the methods used and improve their output.

Keep Yourself Updated

On the Latest Indepth Thought-Leadership Articles From Frank Buckler

Quintessens

As my doctoral advisor Klaus-Peter Wiedmann used to say? “Mr. Buckler, do one thing, don’t do another”. 

We humans still have a distorted picture of what LLMs actually are. They are not “artificial humans” and not databases and neither work accurately nor are they always right. They are, like the human mind, nothing else than an association machine, which -like us- has learned with non-representative data and which -like us- talks smart, but what the whole value is, a validation has to show.

With this picture in mind, it may be possible to use LLMs for tasks that are bungled today. 

Today, the market research industry has the opportunity to occupy the topic for itself and thus create new markets. If it doesn’t do it, others will.

Let’s get it done. Or as Klaus-Peter used to say “there is nothing good unless you do it”.

Her, 

Frank Buckler

Author: 

Dr. Frank Buckler is founder and managing director of Success Drivers GmbH a marketing research agency focusing on the application of AI in gaining insights for marketing and sales. He has been researching AI for 30 years and is the developer of the AI-based causal analysis software NEUSREL. Since the publication of the book “Neuronale Netzte im Marketing-Management” in 2001 by Gabler/Springer, he is a frequent book author in the field of AI and marketing. 

p.s. I have left out of this article that the human being and even the human brain as a whole differs from the LLM in many other aspects. But we will discuss that in another issue of the Future Technologies column.

LITERATURE

Out of One, Many: Using Language Models to Simulate Human Samples | Political Analysis | Cambridge Core

"CX Standpoint" Newsletter

Each month I share a well-researched standpoint around CX, Insights and Analytics in my newsletter.

+4000 insights professionals read this bi-weekly for a reason.

I’d love you to join.

“It’s short, sweet, and practical.”

[wpforms id="4082"]

Big Love to All Our Readers Around the World

ChatGPT & Co in Customer Insights

ChatGPT & Co in Customer Insights

Founder of CX-AI.com and CEO of Success Drivers
// Pioneering Causal AI for Insights since 2001 //
Author, Speaker, Father of two, a huge Metallica fan.

Author: Frank Buckler, Ph.D.
Published on: April 14, 2023 * 7 min read

ChatGPT is making a splash because it’s so simple, so universal, and yet so “human.” Even my ten-year-old son writes stories and solves problems with ChatGPT and teaches his afternoon tutors a thing or two.

Experts talk about Large Language Models (LLM), because besides OpenAI’s solutions (ChatGPT, GPT4 , etc.) there are already other providers such as Google’s BART.

In early March, an article was now published by researchers at Harvard University who were able to reproduce the results of a simple conjoint survey using GPT3 – WITHOUT polling. The researchers instructed the machine to imagine it was a consumer and would go shopping for toothpaste and would see two brands with specific prices. “Would you buy one of them, and if so, which one?” The resulting price-demand function across hundreds of purchases (the machine can behave as erratically as hundreds of different consumers) strongly resembled the results of market research.

Will we still need market research in the future? Is the apocalypse here after all?

The answer, as always, is “yes”. 

Get your FREE hardcopy of the “CX Insights Manifesto”

FREE for all client-side Insights professionals.
We ship your hardcopy to USA, CA, UK, GER, FR, IT, and ESP.

Questionnaire design

LLM are already extremely useful today in giving improvements to questionnaire formulations by suggesting wording. For sure, in DIY platforms like Surveymonkey there will soon be a functionality besides survey templates, where a virtual market researcher (i.e. an LLM) builds a questionnaire automatically, completely according to user wishes.

However, the few months of experience with LLM also show that it depends centrally on the question that one asks the AI. These questions or instructions to the LLM are called “prompts”. A separate profession called “Prompt Engineering” is already forming. Whoever masters the art of prompts – detailed instructions – can create entirely new qualities. 

Not surprising, really. Every service provider knows the purpose of a good briefing only too well. Without a good briefing, no craftsman can build anything useful.

Driver analysis

When designing a questionnaire, and especially when a driver analysis (the analysis of what drives success) is due, the question “what should I ask?” arises. So, for example, what influences a restaurants customer satisfaction? LLMs can help build a list of possible drivers that is comprehensive. 

In addition, time can be saved and mistakes avoided during the creation process. Especially LLMs enable even market research beginners to achieve good results. 

A technically sound driver analysis is always a causal analysis. This includes the consideration of indirect causal effects and the influence of context variables. The reality is that most market researchers are overwhelmed with setting up a causal analysis. This is another area where LLM can help.

This software NEUSREL, for example, has already announced to make the widespread dream come true: “just upload an SPSS or Excel dataset and a causal driver analysis is ready and the result is written out in complete sentences”.

Join the World's #1 "CX Analytics Masters" Course

Text Analysis of Open Ends

AI-based text analysis of open-ended mentions has been growing in popularity for a shorter period of time. But categorizing open-ended mentions in a way that is equivalent to manual categorization has so far required manual training of the AI. In addition, the market researcher must define the codebook himself.

Both of these will be made redundant by LLM in the medium term. LLMs already build 90% perfect codebooks in seconds. Without training, LLMs can perform so-called “single shot” coding: i.e. they can accurately tell whether a verbatim belongs to a category without being trained in advance.

Synthetic Surveys

A “megatrend” in market research is what I call “synthetic” market research. AI trained on data can predict what another market research study would reveal. This already exists in the field in some areas: 

In eye tracking, there are already many solutions that analyze posters or entire commercials and predict with 90% precision how people would actually react to an eye-tracking device.

The same exists in the area of word and sense association. Today we can predict what people associate with certain words, phrases and advertising slogans, whether it fits to a positioning and makes them want to buy – without any questioning at all.

It remains open to what extent LLMs can be used for synthetic market research. Logically, it is obvious that the information is implicitly contained in other information given to the LLM for training. 

The LLM will probably only be able to answer a Sunday question by prompting it with all necessary current information.

How the area of the synthetic surveys will develop, remains speculation, that here still much development work is in it. However, all indications are that there will be specialized solutions that can perform synthetic interviews with the help of elaborate prompts or customized training of the LLM.

In this way, LLMs can also be taught additional information individually by the user with so-called “embedded models”. For example, it would be conceivable to give the machine certain current news or social media information and thus enable the machine to answer current questions.

"Management Summary" at the push of a button.

Dashboards are becoming more and more popular and partially replacing PowerPoint decks. What they can’t do is summarize the quintessence of the situation in full sentences. This is exactly what LLMs can now do and thus again partially replace the market researcher. 

Creation

But LLMs can do more than just speech. They can already generate images and videos today. In the future, AI will be able to deliver a packaging design or advertising poster draft that most closely matches the market research results.

This creates the opportunity to link market research more closely to implementation and thus increase its relevance.

Keep Yourself Updated

On the Latest Indepth Thought-Leadership Articles From Frank Buckler

Education

Through LLMs, education (including market research education) will change completely in my opinion. The fact is that almost all professionals working as market researchers have not learned this “profession” and probably would not pass a university exam in market research. 

LLMs make the cramming of data and information obsolete. What it takes is a healthy curiosity and problem sets available through application practice. Through a chat conversation with LLMs, learners can acquire core knowledge in a very short time.

This in turn, means that anyone who spends a few weeks immersed in the subject can very quickly become a “market researcher”. LLM brings the democratization of knowledge and education – worldwide at almost ZERO cost.

Sure, there is no guarantee that the LLM speaks the “truth”. But they honestly don’t have that guarantee in textbooks either. Just take two and compare what they say. Furthermore, the learner has it in his own hands to optimize the knowledge quality with good prompting.

Conclusion

Market researchers will always exist. There was the profession of the shoemaker 500 years ago, and it still exists today. At that time, every 100th person was a cobbler, today, it is every 100,000th person. 

This will also be the case for market researchers. AI will automate his expertise step by step, and soon, everyone can do his job. 

You can choose, row against the current or become the sailor and master of “AI winds” of time.

"CX Standpoint" Newsletter

Each month I share a well-researched standpoint around CX, Insights and Analytics in my newsletter.

+4000 insights professionals read this bi-weekly for a reason.

I’d love you to join.

“It’s short, sweet, and practical.”

[wpforms id="4082"]

Big Love to All Our Readers Around the World

Innovation first? No! Simply Be Better.

Innovation first? No!

Simply Be Better.

Founder of CX-AI.com and CEO of Success Drivers
// Pioneering Causal AI for Insights since 2001 //
Author, Speaker, Father of two, a huge Metallica fan.

Author: Frank Buckler, Ph.D.
Published on: December 1, 2022 * 7 min read

Differentiation and innovation are wasteful exercises when not focused on the basic category need. Instead, innovation should be concerned with becoming simply better at what customers, in essence, care about most. This is the learning of large-scale decade long marketing science research. Mostly overlooked is the crucial role of the ability to find those often hidden basic needs of a category.

Inspired by a recent guest of my podcast “Insights Rockstars” I am sharing here an amazingly important route of thoughts for Customer Experience professionals.

Although customer experience has gained importance in the last two decades, there is always debate about its value. CX has the image of incremental and minor improvements. As opposed to strategic product and business model moves, it might feel like just a “must do” but not the thing where you are winning the game.

Even worse research proves -known as the double jeopardy law– that big brands, by definition, have more loyal customers. It is an inevitable fact that the best strategy for loyal customers is to acquire market share. Market leaders do have better NPS scores even if their performance metrics are not leading. (just one of many reasons why benchmarking is a dysfunctional exercise)

Before you now stop reading and start quitting your CX or insights job, bare with me 😊

The magic of great customer experience is not to be the delighter or to provide an emotional cream topping. The magic is that a great customer experience evolves AT the moment when you perfectly meet customers’ basic category needs. Here is why.

Get your FREE hardcopy of the “CX Insights Manifesto”

FREE for all client-side Insights professionals.
We ship your hardcopy to USA, CA, UK, GER, FR, IT, and ESP.

“Great CX creates competitive advantage. The consequences is brand and loyalty growth.”

Worlds largest and most reputed marketing science institute is the Ehrenberg-Bass Institute which builds its work on decades of global research, first led by Andrew Ehrenberg and Prof. Bass. Worlds largest brands, like Coca Cola, Colgate-Palmolive, Mars, or Unilever,  now sponsor this institute – a proof for its practical relevance.

A core fundamental law they discovered is that consumers do not seek differentiated or even unique products and services. They simply choose a brand that best satisfies the basic needs that a category is supposed to satisfy. 

Being able to do this consistently better will create a competitive advantage, will make customers come back, and will grow your brand. 

Customers may better recognize and remember distinct advertising and packaging, which may lead to more sales. But when it comes to the product and services, being different does not count – being better does.

Many brands that we think have introduced disrupting innovations, in truth have been incremental. Pampers just evolved as an improvement of a competing niche brand. The whole concept of Apple is to make devices more user-friendly and pleasing. All their successes had been incremental improvements, not disruptive inventions.

Join the World's #1 "CX Analytics Masters" Course

The Three Fundamentals of CX Strategy

All boils down to three fundamentals that you need to follow to succeed


1. INSIGHTS FIRST


Truly understanding what customers’ basic category needs are, is the foundation of every success. This sounds trivial, and it is
where most companies fail because they underestimate the deceptive feeling of “knowing it all”. 

German beer brands, for instance, have been in the markets for centuries. It turns out that most of them still do not understand the core need behind a standard beer consumption: a refreshment drink for adults. A standard beer is not a craft beer that is consumed like a good glass of wine. Its main purpose is to be refreshed.

How can brands gain such fundamental insights? Asking customers? What customers answer is biased and superposed by many others things. Customers -especially in low involvement categories – are hardly aware of why they consume a product or category

Still, it is possible to find out. All starts with the understanding that this – like most important insights – is a question of cause and effect. What causes consumers to drink beer over wine, Budweiser over Becks? 

It requires a causal analysis. Not just descriptive data, correlation, comparing groups, or just doing qualitative exploration. Luckily applying Causal AI is a common practice in insights. E.g.  www.cx-ai.com  is an approach that even integrates qualitative feedback.


2. BECOME SIMPLY BETTER: Be Better at Product & Service


Ones you know what’s important from the
customers’ implicit viewpoint, you can start to work on this. This work should become a strategic long-term focus. Focusing means saying “no” to other relevant topics. 

A global leader in industrial packaging sticks in my mind. We took a look at customer feedback with the lens of finding the essence of the industry. 

Originally we were thinking of the company having a broad product range, being cost-competitive and have flexible delivery process is key in the industry. Oh boy, we were so wrong.

We finally understood that it is all about safety and security. Industrial packaging mostly carries nasty chemicals or other expensive liquid products. Any leakage, any delivery problem, any stacking issue, or any deviation from a norm is causing massive problems for the buying decision-makers and their stakeholders. 

In essence, most buyers look for “the safe choice”.  Along the way we needed to realize that “the safe choice” can not be just marketing claim and must be a commitment and promise towards the customers. It turned out that “the safe choice” needed to be an internal product and service strategy first. 

Just in a second step, it could become a positioning in communication. 


3. NO COMPROMISE 


While its key to simply become better in what really counts for customers, for communication, another topic kicks in.

Communication job is foremost to achieve that your brand is recognized and considered in the moment of purchase. This is done by being rememberable, by being distinct in all kinds of simple aspects.

This does not mean that your product or services should be distinct. It is of most importance to detangle and not mix both tasks.

Keep Yourself Updated

On the Latest Indepth Thought-Leadership Articles From Frank Buckler

CX Is The Winning Factor

Customer Experience Management is the holistic management of customers’ experience of a brand’s products and services.

As such the research described in this article suggest that CX Insights is the key enabler in developing a competitive advantage, which in turn will result in brand growth and loyal customers.

CX professionals are advised to use this route of thought to convince the company of the true cause of growth and prosperity

It takes 

Thoughts?

Write me at frank@cx-ai.com

"CX Standpoint" Newsletter

Each month I share a well-researched standpoint around CX, Insights and Analytics in my newsletter.

+4000 insights professionals read this bi-weekly for a reason.

I’d love you to join.

“It’s short, sweet, and practical.”

[wpforms id="4082"]

Big Love to All Our Readers Around the World

REINVENTING NPS: A Call for Corporate CX Pioneers

REINVENTING NPS:
A Call for Corporate CX Pioneers

Founder of CX-AI.com and CEO of Success Drivers
// Pioneering Causal AI for Insights since 2001 //
Author, Speaker, Father of two, a huge Metallica fan.

Author: Frank Buckler, Ph.D.
Published on: November 11, 2022 * 7 min read

NPS embodies one of the most common KPIs for the last two decades. Moreover, it served well and helped organizations become much more customer-centric. All signs, however, indicate that the CX industry is losing grip. Progress in customer centricity is becoming harder and harder and most of companies have reached a plateau.

Even Bruce Temkin (Co-Founder of CXPA) and early NPS ambassador recently published an article describing the need to reinvent NPS. He called it “True Loyalty Measure”. 

New tech vendors popping up and suggesting pNPS (predictive NPS) or eNPS (emotional NPS) – all pointing out other drawbacks of the NPS system. Against the background of this potpourri of small-scaled NPS facets, maybe it’s time to put it all together and develop something holistic and robust.

In this idea pitch, firstly, we will outline the current key challenges of the NPS. Secondly, we will illustrate a potential solution that leverages cutting but established 21st-century technology.

Besides all scientific and technological explanations, this idea pitch is intended as an invitation and inspiration to and for you as a corporate CX decision-maker. With you, we are willing to build the next phase of CX insights. 

It takes your initiative to move the industry.

Get your FREE hardcopy of the “CX Insights Manifesto”

FREE for all client-side Insights professionals.
We ship your hardcopy to USA, CA, UK, GER, FR, IT, and ESP.

Challenge No.1 - Benchmarking is expensive or sometimes not even available

Benchmarking is a key exercise every C-Suite is asking for. At the very core, the management wants to know, “Is this a good score or is it a bad score?”

To answer this, customer insights teams sometimes struggle to find truly comparable benchmarks. Many companies invest in large NPS trackers that measure the NPS of all relevant competitors. Results still leave most experts puzzled. It often seems to be mysterious why, e.g., the market leader has such a high score.

Benchmarking even becomes impossible if you want to benchmark touchpoint/journey scores.

Research has shown that not only loyalty is impacting the NPS score but also brand strength and market share. We need an explanatory -not only a descriptive- answer to the question of “Is our performance good or bad?”

Challenge No.2 - Need for a highly reliable measure

More and more NPS scores are used to incentivize the management of a company. This requires the score to be true and robust. In both aspects, the NPS system is easy to attack.

The NPS score is not true

The likelihood to recommend is a rating scale that delivers responses that are highly biased by rational filters and methodological effects. Often loyal customers tend not to pick the 10 out of strategic rationale. Also, customers have a subconscious tendency to be polite and avoid picking 0-5 points on the scale. 

Furthermore, only the endpoints of the scale are defined. As a result, you find major cultural differences in responding to the scale. The general concept of a 0 to 10 rating comes from the anglo-american region and is largely unknown in most other parts of the world. As such, people respond differently due to their traditions.

Other topics are biasing results: most customers you ask do not participate. What would have been their answer? Depending on the self-selection process, your results a chronically screwed. There are modeling methods for debias available, but they are hardly ever applied.

The NPS score is not robust

The score calculates from the difference of percentage share values (% of promoters vs. % of detractors). As a well-known statistical phenomenon, small percentage scores have huge error bands for small sample sizes and, as such, are largely impaired compared to averaging Likert scales. 

This impact is even amplified if you start to weigh your sample e.g., as you want to overweight your high-value customers. If, suddenly, one instead of two high-value customers are among your promoters, the NPS score changes dramatically.

Challenge No. 3 - Unexplainable differences in NPS

Companies witnessing unexplainable differences between NPS scores. Large competitors often tend to have better scores, although some of them do not outperform your performance in any way.

The same you find when comparing NPS scores between countries or regions of the same brand.

Even worse with scores related to a touchpoint (or journey) survey. It’s hard to compare it with other touchpoints.

Part of the unexplainable differences can be explained by drivers or impact analysis. It helps to learn why the NPS is high are low.

But mostly, still, half of the variance stays unexplained. In other words: half of the differences in NPS is not due to CX performance but thru the specific market situation and brand strength.

Join the World's #1 "CX Analytics Masters" Course

Imagine there would be a solution…

Imagine there would be a solution that estimates a better NPS score. The score will be above 100 if the company performs better than a predictive model would expected based on the industry, touchpoint and market position. The predictive model is calculating the expected value of a look-alike company.

It would be below 100 if worse than such a look-a-like company or brand. The same applies to touchpoints or region cuts. 

It would make benchmarking not only redundant. It would provide a much better answer of the question, “are we doing well”. 

Imagine further that this new score is based on the neuroscientific measurement of implicit attitudes. (Actually, loyalty IS an implicit attitude). This method is intrinsically metric and not based on percentage values. As such, it has the foundation to be more reliable, robust, and true.

Imagine, finally, the score even controls many biases and also is able to retrieve more information from each customer (without the need for more time), which is used to stabilize the score.

Such a system provides for the first time a reliable benchmark for performance.

Why?

The worlds-largest marketing institute Ehrenberg-Bass conducted many large-scale studies (published in Byron Sharps’s famous book “How brands grow”). One key finding was that -independent from the category- larger brands have more loyal customers not because they are good but because they are large. Exactly this is what you find in CX studies around the world. 

The very same finding is independently backed by the results of the iconic PIMS study finding thru modeling that market share is the key driver of profitability. This impact was found to be independent of any other business metrics. In other terms: market share drives customer loyalty and, thus, profitability. There are not just confounding other reasons (e.g. a better performance) that make market share appear to correlate with loyalty and profits.

From this perspective, benchmarking with competitors never made sense. 

With the following new system, now, it will.

Keep Yourself Updated

On the Latest Indepth Thought-Leadership Articles From Frank Buckler

REINVENTING NPS: “Supra CX” as our proposal

The following process has been planned out in order to solve all challenges above. We will build a survey, analysis, and data interfaces to make this system usable for everybody.


STEP 1 – REINVENTING  the survey process

  • We run a four-item implicit association test (IAT) that, on average, takes in a total of 10 seconds. It will be designed as a tinder-like setup, which frees from the need to brief respondents in great detail.


  • Followed by an open-ended question on why. Instead of restraining to a open text form, the audio option should become the new standard. It provides much more information, is more customer-friendly and also give more emotional context.


STEP 2 – REINVENTING the score with machine learning

  • Collect prior to the survey the context information on the business (market share of the country, brand, region, etc.), and use the customer information if available, like customer segment, time of day, age, gender, and customer since,..


  • Build a score based on the IAT responses and build a machine learning model that explains that score using all available information on the customer and the context.


  • Use all available information, including categorized open ends, to predict the true likelihood-to-recommend score. This helps to increase the robustness of the then-calibrated score further. It enables to report of scores of entities with very low sample size, such as of N=25.


  • We simulate the resulting score pretending to be a norm-market share. This is your “look-alike score” – the benchmark that you should aim to outperform.


STEP 3 – REINVENTING explaining why

  • Run drivers analysis using the text categorization and context information, preferably using causal machine learning – a method used at www.cx-ai.com
  • Audio information needs to be auto-transcribed first.


STEP 4 – REINVENTING  Deliverables

  • Online dashboard to view and analyze the score, the customer topics impact, and an impact simulator and a bridge that explains why the score changed that way.


  • API that enables delivery of that information. This enables you to report results in your existing dashboard environment.

Engage and help to move the industry

To implement this “Supra CX” concept in accordance with market needs, we need “you”. We can only work with one corporation (or a consortium) and develop and pilot the described system. All parts of the system are proven and tested. The task is not to develop the tech. The task is to tweak the setup and prove that it solves the issues outlined in this article. 

Are you willing to engage in such a pilot? Write me via frank@cx-ai.com 

Do you have an opinion on what needs to change? Write me via frank@cx-ai.com 

Do you want to suggest a contact of yours and engage him/her? Write me via frank@cx-ai.com 

Write me!

Frank

"CX Standpoint" Newsletter

Each month I share a well-researched standpoint around CX, Insights and Analytics in my newsletter.

+4000 insights professionals read this bi-weekly for a reason.

I’d love you to join.

“It’s short, sweet, and practical.”

[wpforms id="4082"]

Big Love to All Our Readers Around the World

The Confirmation Dogma

Rigor or Dogma?

About Theory-Led Research for Businesses … and Alternatives

Founder of CX-AI.com and CEO of Success Drivers
// Pioneering Causal AI for Insights since 2001 //
Author, Speaker, Father of two, a huge Metallica fan.

Author: Frank Buckler, Ph.D.
Published on: September 08, 2022 * 6 min read

“Build hypotheses and test them” is the guiding idea of social science that guides how practitioners try to solve marketing and sales insights problems today. However, the damage of this confirmatory research principle to business practice is huge. This becomes only obvious if you take a closer look. Let me illustrate here why this is, why exploratory causal analysis is needed in many cases and how AI can help.
First, why does confirmatory research make sense?

Of cause, there is a reason why confirmatory research is so dominant in social sciences such as marketing science. Social matters are typically very complicated. When you see a correlation it does not mean there is a relationship or a causal link. 

People tend to find reasons for correlations after seeing a correlation. But prior to the fact, the same person would have disregarded the hypothesis.

But when you have a hypothesis upfront that is based on a system of tested theories, and if then this hypothesis matches with the correlation measure after building the hypothesis, then – yes then the likelihood that the hypothesis is true is high.

The same approach still makes sense in multivariate models such as causal network models. 

The example of the ancient philosopher HUME says: When a pool ball is struck by a stick – this could mean the stick causes the ball to move or the ball caused the stick to it them. Only your theory about pool billiards will tell you which version is more plausible.

Since now over 200 years this is the main idea behind social science. While being plausible, its practicability is so seldom questioned.

Get your FREE hardcopy of the “CX Insights Manifesto”

FREE for all client-side Insights professionals.
We ship your hardcopy to USA, CA, UK, GER, FR, IT, and ESP.

The right approach at the right time

Yes, we all are hunting for the truth. A closer look will reveal that confirmatory approaches are well preferred in this circumstance:

  • You have a validated theory framework behind your hypotheses

  • With this you can assume that there is no unknown confounder that influences potential cause and effect at the same time

  • Your assumptions on the type of relationship (linear, nonlinear, free of the moderating condition, etc.) are ideally backed by a validated theory framework too.

If you have this at hand your confirmatory analysis will probably be the best method to use.

Sure if you are in doubt it might be wise to consider more explorative methods prior to using confirmatory methods. Here is a spectrum ranging from very explorative and qualitative to a quantitative approach that augments explorative with confirmatory approaches.

  • IDI – In-Depth Interview
  • Open-ended questionnaire questions
  • Data Mining
  • Causal Machine Learning

Most practitioners will agree: If you are new to a field, there is nothing better than talking face to face with customers in in-depth interviews. Yes, it is biased. But it helps you to understand holistically what might be important.

As always, the world is not black or white. There is something between pure qual and confirmatory quant.

There is a tendency to view confirmatory research as “better” than qualitative or quantitative explorative methods. Indeed, when the requirements are met, it is “better”. 

Based on your experience, how often are confirmatory methods applied when actually requirements are clearly violated? Would you still use it if you would know a viable alternative?

A true story from SONOS

David ran this customer satisfaction survey for SONOS. They reached out to every new customer one month after purchase. What David saw in the data was a big correlation between “excellent customer support” and loyalty/recommendation. It was validating what everybody believed. Not only that they build a multivariate model based on their hypotheses and well: the hypothesis was confirmed.

Taking a bit more explorative but still causal approach to the model (Causal Machine Learning) they included so-called context variables in the model. These are variables that may or may not explain outcomes or even moderate other effects. 

Long story short: it turns out that customer support only correlates with (and “explains”) loyalty, because those buyers that already had SONOS speakers needed less support, and therefore, had less trouble, and naturally are more loyal and recommend more. The statistical ”effect” was spurious and no confirmatory approach could ever find this out. Why? Because it was missing the confounding variable “already existing customer” in the model. 

Theory as well as “models are always wrong, some are useful” is a famous quote from George Cox.

Join the World's #1 "CX Analytics Masters" Course

A true story from a beer brand

Jordi was running the Marketing and Sales of Warsteiner – a leading German beer brand. They wanted to relaunch the beer case and needed to find out if sales would drop or even increase with a better case. Investing in a new beer case is a nine-figure investment.

A/B testing is a scientific confirmatory experiment and is seen as a highly valid method. Doing that they found that the new case would lose nearly 10% of sales. 

A causal machine learning exercise however discovered something that (after the fact) made much more sense. The new case looks better and the customer like more in all relevant associations. But it lacks familiarity. The model showed that familiarity is one of the main drivers of purchase, which explains the drop in the A/B testing.

Now, any new design will lack familiarity. It grows over time, the more customers see the new design in the shops or in the commercials.

Now the cause-effect model could be used to understand this: When the new beer case design will be as familiar as the old beer case, the brand will sell 7% more, not 10% less.

A/B testing can be like comparing apples with oranges. If you sit on an imperfect hypothesis the rigor of your approach can be the cause of your failure.

A true story about Sales Modeling

Daniel was heading the commercial excellence program of SOLVAY – a pharmaceutical brand. He collected data on the activities of the salesforce and all marketing support activities. All this was fed into modeling to understand which actions drive most prescriptions.

One of the hypotheses of the confirmatory modeling was that providing product samples would drive prescriptions. But no matter how you tweak the modeling it always came to the conclusion: no significant impact.

Daniel tried a causal machine learning approach and was blown away by the elegance of the finding: Providing product samples has a nonlinear effect – an inverted U effect. Here is why.

If you provide samples it will help patients to try and eventually to use it long-term. However, if the physician has too many samples on stock, he becomes the sole source of the medication for more and more patience.

Some sales reps simply sampled too much, some not enough. Sampling makes sense but you need to have the right balance.

Nobody was hypothesizing the nonlinear effect. Still, causal machine learning could discover it and it turned out to be very useful.

A true story from a CX research

There is a seldom shared pain in confirmatory modeling: often times coefficients turn out to be counterintuitive, e.g. showing a negative effect instead of a positive one.

Mel was running a CX program for insurance and she had this very same problem. “Excellent service” had a negative impact on the Likelihood-to-recommend. This made no sense at all.

Later it turned out that his confirmatory approach was the route cause. It is common practice to only include explaining variables in a model if there is a good hypothesis for its impact.

The point that this procedure totally misses is that eliminating a cause from a model is a hypothesis on its own. It assumes this cause has no impact.

Instead, it’s a good practice in causal machine learning to add “context information” to the model. For Mel it changed everything to add the customer segment as an explaining variable.

It turned out that there are segments with higher expectations which are having a lower likelihood to recommend at the same service level. While they have seen at times even better service levels, it leads “service” to correlate slightly negatively with the likelihood to recommend.

Due to including the segment, a Causal Machine Learning can derive from data, that the outcome offset is due to the segment but better service still improves the outcome.

Keep Yourself Updated

On the Latest Indepth Thought-Leadership Articles From Frank Buckler

A true story from T-MOBILE USA

It was 2013 when T-Mobile reinvented itself. The repositioning worked and the brand was growing. Only nobody exactly knew why. So they took a look at the brand tracking data. Modeling was done to reveal, which of the customer perceptions and service properties were causing the customer to come. With little success. No clear answer was available.

David – the head of insights at that time – was looking for fresh approaches and ran a causal machine learning exercise. The approach takes all information/variables available and structures it in a knowledge-led way: specific items about the service are seen as a potential cause. Purchase intent and consideration as an outcome. Other more vague items like brand perceptions are modeled as mediators. Also, context variables are included as potential moderators.

Someone had asked the team to include the item “T-Mobile is changing wireless for the better” into the tracker to measure whether or not the repositioning works. 

As one of many items that could be a mediator, it was included as such in the model – not theory-led but “possibility-led”. This move changed the whole history of the company with a 6-fold market evaluation a few years later.

The analysis revealed that none of the changes like end-of-contract-binding, flat rate or free-iPhone were directly driving the customer to buy directly. It was that those actions perfectly reasoned why the new positioning is valid. This new positioning perception -to be the un-carrier- was what attracted customers. The learning was to continue introducing new features that reasoned the very same positioning.

Only a modeling approach that allows handling vague hypotheses in an explorative setting was able to discover what the company needed for its growth.

What can we learn, what can we do?

It seems that confirmatory research has some blind spots. You don’t know what you don’t know.

The question is if it would make sense to change the way we look at it: Instead of asking “what is the best approach in general”, why can’t we ask “what is the right approach right now?”

Confirmatory research brings most certainty and validity – only if the requirements are met.

More exploratory research is by design made to make us learn more, designed to discover new knowledge.

Sure, the discovery comes with failure, but as examples show us, confirmatory research too often provides illusory security.

Shouldn’t a researcher ask himself: Do I want to discover or do I really want to validate?

Write me!  

Frank@cx-ai.com


p.s. Can “Causal AI” the new North star?

The recent Gartner Hypertrend Report now shows “CAUSAL AI” as one of the most promising technologies. It says that in 5 to 10 years the technology will be the tech that everyone needs to have to be not a laggard.

The two most promising platforms for Causal-AI are CausaLens which just received 50m funding and NEUSREL.com. While CausaLens is probably great for enjoying a good user interface, is -in my opinion- Neusrel technology-wise most advance.

At the end, you need to build your own opinion. 

Trying out is the way to know better 😊

"CX Standpoint" Newsletter

Each month I share a well-researched standpoint around CX, Insights and Analytics in my newsletter.

+4000 insights professionals read this bi-weekly for a reason.

I’d love you to join.

“It’s short, sweet, and practical.”

[wpforms id="4082"]

Big Love to All Our Readers Around the World

Text Analytics to the Rescue

Text Analytics to the Rescue

Founder of CX-AI.com and CEO of Success Drivers
// Pioneering Causal AI for Insights since 2001 //
Author, Speaker, Father of two, a huge Metallica fan.

Author: Frank Buckler, Ph.D.
Published on: July 5, 2022 * 5 min read

Text analytics had great success in recent years and most larger enterprises use them in CX in one way or the other. But still, most companies are far from getting a lot of value out of it. It’s more like a piece of software that someone plugged in the process. Here is why this is a problem and how companies can circumvent them.

Text analytics software is supposed to read and understand unstructured qualitative feedback. This understanding is defined by associating a verbatim with the correct theme. In short, the task is all about categorizing text feedback into a finite set of topics or categories.

First and still most used text analytics methods are unsupervised. They analyze a set of feedbacks and start to cluster and build topics. The problem: for simple matters, it makes even a good first impression. But when you look more closely, it doesn’t perform even nearly as well as a human reader would do.

The more specific and complex the feedback, the more apparent the lack of understanding becomes.

Sure, the algorithm has no deeper industry knowledge. So far there is no alternative than using AI that can be tough by domain experts – the human.

Even this – done naively – can do more harm than good. 

After all, even worth, at the end of a text analytics implementation this question always: Now what? What do we learn from this? Should we really fix this?

I like to share three principles that can help see the light.

The effort is worth it. Being able to leverage unstructured customer feedback is worth gold. It is truly customer-oriented to not torture respondents with lengthy closed-ended questionnaires, but simply ask a question or two and let customers express themselves in their own words.

This enables you to conduct research on every customer and every touchpoint, and get in-depth insights with a comparably simple research approach.

Get your FREE hardcopy of the “CX Insights Manifesto”

FREE for all client-side Insights professionals.
We ship your hardcopy to USA, CA, UK, GER, FR, IT, and ESP.

How MICROSOFT drives value from unstructured feedback

The brand runs one of the world’s largest B2B customer trackers collecting over 200.000 feedback every year. Early on it adopted text analytics but the depth of insights a convention text analytics can extract from highly technical feedback is sobering. The categorization in 20 rather generic categories like Quality, Price, or Service was not very helpful and prone to failure as well.

Microsoft implemented already in 2019 a highly sophisticated text analytics approach. Trained by domain experts it gives nearly 200 highly granular topics. Not only that it proved that the accuracy even exceeds human categorization.

Not only that. The brand invested in an elaborated driver analysis – a causal machine learning that identifies the impact that an improvement in a topic would have on customer satisfaction. 

Now, instead of looking at 200 topics and how they changed, the team is focusing on those positive topics that will have the highest impact (hidden drivers) and those who are negatively important and too often mentioned at the same time (leakages).

Join the World's #1 "CX Analytics Masters" Course

The Three Principles of Good Text Analytics for CX

These are the fundamental principles to consider in order to drive value from your customer’s unstructured feedback

1. Build your own codebook and use the right AI

It’s not enough to just buy a text analytics software or subscription. In most cases it does not fully satisfy the expectations your business partners have today. 

What you need is a text AI that you can train. 

This training starts by defining the set of themes (codebook) that you want your customer’s feedback gets quantified. You don’t want to outsource this to software. 

Be sure the software you are using has the right measures to validate its accuracy. E.g. you do not want to look at hit rates but F1 score.


2. Train it well

Garbage in garbage out: Training itself has some tricks and trades that you can either learn yourself or you can find external partners who are experienced in this.

It’s not enough to use a domain expert. The codebook should be documented well and the person should stay the same over time – or the handover phase should be extensive.

Over time training is changing the way your system categorizes feedback. Either you stop training to maintain consistency (not recommended, as the accuracy will decay over time) or you must rebaseline the past once in a while.

It’s important to communicate this expectation early on: No categorization will ever be perfect. 


3. Do NOT interpret text analytics – its just data

The greatest misconception about text analytics is jumping from data to conclusions. Intuitively businesses look at the most often mentioned topics. Because they believe these are the reasons for success or failure.

Even worse: this makes perfect sense as it is the answer to the question “why did you rate that way”. And the customer is telling us why.

However, it turns out that the frequency of mentionings and importance is largely uncorrelated.

In other words, whenever you give your business partners unguided access to frequencies of topics, they will most likely conclude with highly imperfect decisions.

The Microsoft case above shows how this issue must be solved.

Keep Yourself Updated

On the Latest Indepth Thought-Leadership Articles From Frank Buckler

State-of-the-Art Text Analytics

Text analytics is an amazing opportunity to discover unbiased insights in an easy and practical form. 

The state of the art relies on deep learning AI systems that are not only pre-trained but still can be trained by domain experts. This training requires some care and rigor in the process to avoid garbage-in-garbage-out.

To finally derive business value from text analytics it must be linked to some kind of driver analysis process. Even in this respect are (causal) machine learning approaches most appropriate.

A detailed education program on the state-of-the-art provides the world’s largest CX Analytics Masters course. It is open since spring 2021. Here is more https://www.cx-ai.com/cx-analytics-masters

The safe and easy way of course is the use vendors like www.cx-ai.com who have perfectionated all those measures and provide those processes as a managed service.

More background provides also my latest book “The CX Insights Manifesto” available at Amazon.com, co.uk, .ca, .it, .fr and .de.

Cheers 

Frank

"CX Standpoint" Newsletter

Each month I share a well-researched standpoint around CX, Insights and Analytics in my newsletter.

+4000 insights professionals read this bi-weekly for a reason.

I’d love you to join.

“It’s short, sweet, and practical.”

[wpforms id="4082"]

Big Love to All Our Readers Around the World

The Customer Experience of Pricing

The Customer Experience of Pricing

Founder of CX-AI.com and CEO of Success Drivers
// Pioneering Causal AI for Insights since 2001 //
Author, Speaker, Father of two, a huge Metallica fan.

Author: Frank Buckler, Ph.D.
Published on: June 14, 2022 * 3 min read

When companies who do not position as cost leaders do NPS studies, VOC studies, or alike, one theme pops up regularly: “Too expensive”.

The intuitive interpretation is that lowering the price will improve the customer experience, satisfaction, and loyalty. That’s obvious.

But at the same time the question arises: Does the loss in margin really pays off thru less churn and higher cross-selling?

At the resource section of cx-ai.com and CX.AI’s Master Course you can learn, how you can find out, how much bottom-line impact lower prices would bring.

But the big question “how exactly will be existing and new customers respond to price changes?”

Get your FREE hardcopy of the “CX Insights Manifesto”

FREE for all client-side Insights professionals.
We ship your hardcopy to USA, CA, UK, GER, FR, IT, and ESP.

Update your Pricing Know-how

Because of those reasons, as a CX professional, you need to be aware of the critical role pricing has for every company. This article gives a perfect introduction:

https://supra.tools/why-pricing-is-the-most-underestimated-consumer-goods-profit-lever-and-what-you-can-do-about-it

Once you have acknowledged the pricing decision as your #1 lever to manage your profitability, you know it’s important to measure customers’ willingness to pay.

Here is an overview of classic methods to accomplish this:

https://supra.tools/classic-survey-methods-for-finding-optimal-prices-in-focus-the-gabor-granger-method

Join the World's #1 "CX Analytics Masters" Course

Everyone knows Conjoint analysis. Many view it as the holy grail of price measurement. Here is a review of different Conjoint methods and a conclusion that it is by no means a holy grail.

https://supra.tools/conjoint-surveys-for-pricing-consumer-goods-why-when-and-which-conjoint-analysis-makes-sense

The latest trends lead to methods that combine Neuroscience with Artificial Intelligence. The interesting part: it makes it simpler, easier and better. This article gives an overview.

https://supra.tools/implicit-intelligencetm-a-new-gold-standard-in-price-research

Keep Yourself Updated

On the Latest Indepth Thought-Leadership Articles From Frank Buckler

Whenever Pricing is an issue in your CX research…

Whenever “too expensive” is an issue in your CX research and stakeholders ask you what to do, you need to respond:

“I don’t know …  yet.”

But what you know is this is your moment to research the #1 profit lever of your company: pricing.

Having updated yourself in pricing research methods you are now equipped to decide whether Garbor Granger type methods, Conjoint analysis, or Implicit Intelligence tools might be good for you.

"CX Standpoint" Newsletter

Each month I share a well-researched standpoint around CX, Insights and Analytics in my newsletter.

+4000 insights professionals read this bi-weekly for a reason.

I’d love you to join.

“It’s short, sweet, and practical.”

[wpforms id="4082"]

Big Love to All Our Readers Around the World
Why “impossible” solutions are already around us – without our notice

Why “impossible” solutions are already around us – without our notice

Founder of CX-AI.com and CEO of Success Drivers
// Pioneering Causal AI for Insights since 2001 //
Author, Speaker, Father of two, a huge Metallica fan.

Author: Frank Buckler, Ph.D.
Published on: May 3, 2022 * 5 min read

Too often companies try to solve their challenges and pains by going out onto the “market of solutions”. They ask some peers, to look at G2, Captera, or simply Google for it. Then vendors are evaluated. Most of the time though you find that there is no perfect solution yet available.

This article here is to remind you that this is actually not true! Chances are high that things ARE doable. Solutions ARE already possible. You just need to be brave enough, reach out to some talents and pioneers and let them do what can work – if you just try.

“Aren’t the major invents been already made? The wheel, the lamp, the computer?” This is what a fellow Ph.D. student asked me back then in 2000.

I was shocked that he ask such questions.

22 years later I need to conclude: Not only is it amazing which investors are popping up year by year. Even more: No matter which mission impossible you can think of, chances are that the solution is already around us. You just need to find it.

You don’t believe me?

You will – if you follow me back in time and let me guide you thru 3 examples from my field of expertise “Unearthing success drivers from data”

Get your FREE hardcopy of the “CX Insights Manifesto”

FREE for all client-side Insights professionals.
We ship your hardcopy to USA, CA, UK, GER, FR, IT, and ESP.

The History of Key Driver Analysis

The basic concept behind driver analysis is the multiple regression which was published by Legendre in 1805 and by Gauss in 1809.

Unilever is using it since 1919 for Marketing Mix Modeling.

Even today too many marketing executives view the method as “advanced analytics”. It is still more common that practitioners to compare KPS or look at correlations instead of using regression.

Even worse, many software companies use multiple regression and call is “Artificial Intelligence”.

The potential that is available since 1805 is still 200 years after being largely underleveraged.

Join the World's #1 "CX Analytics Masters" Course

The History of Machine Learning

The invention of the backpropagation concept was the ultimate breakthrough for machine learning.

Long time this invention was attributed to Rumelhart, Hinton & Williams published in 1986.

Just yesterday I learned that the technique was independently discovered many times, and had many predecessors dating to the 1960s – the earliest Henry J. Kelley in 1960 and by Arthur E. Bryson in 1961

Imagine! A lot of what we know as modern Artificial Intelligence is already possible since the 1960s. Its 60 years ago!

And I would not be surprised to learn that lots of pilot applications already happened in the 60s and 70s. We just don’t know about it.

The History of Causal Machine Learning

The concept of causality was a long time just a matter of philosophy  -mostly known by the work from Hume (1748).

Later the statistical framework of the multiple regression served as a means to calculate causal impact. Later major contributions followed by Granger in 1969, Pearl 2000 and Rubin 1974 added techniques to identify causal directions from data.

My own contribution in this space focusses to combine machine learning with causal inference. This for a practical reason: It turns out that it’s the most versatile, predictive, explanatory and practical way of modeling, reasoning and predicting.

I am publishing my work since 2001. It feels a bit like a treadmill. There is progress but large growth percentage on something small is still tiny. There are amazing success cases.

Still, the vast majority of possible applications don’t know about it. This will probably not change in the decades to come.

Now looking back to Key Driver Analysis and to Machine Learning gives me patients. When AI needed 60 years to prosper, I can not expect Causal AI to do in 20.

Keep Yourself Updated

On the Latest Indepth Thought-Leadership Articles From Frank Buckler

My Take Away

Imagine you are in 1880 running a consumer product business. Key Driver Analysis would be available already to perform Marketing Mix Modeling (you just need to run it by paper and pencil).

Imagine you are in the 70s building one of the first home computers like the Mac – you could have built-in Artificial Intelligence already back then – if you would have understood the power of it.

Imagine you are who you are today. You are eager to understand better than anyone what are the hidden causal reasons, the ultimate actions that most effectively drive success. You could run causal machine learning already today. Learn how things relate and influence each other.

Just DM me 😉

Frank

(frank@cx-ai.com)

"CX Standpoint" Newsletter

Each month I share a well-researched standpoint around CX, Insights and Analytics in my newsletter.

+4000 insights professionals read this bi-weekly for a reason.

I’d love you to join.

“It’s short, sweet, and practical.”

[wpforms id="4082"]

Big Love to All Our Readers Around the World