CX.AI -Experience the new generation of CX Insights

Category

Allgemein

How To Avoid Unstable CX Scores?

How To Avoid Unstable CX Scores?

Founder of CX-AI.com and CEO of Success Drivers
// Pioneering Causal AI for Insights since 2001 //
Author, Speaker, Father of two, a huge Metallica fan.

Author: Frank Buckler, Ph.D.
Published on: October 19, 2021 * 14 min read

With the help of a CX score, you can learn the percentage of customers who are pleased with your services or products and those who are not. It also helps you get valuable insights into the areas where you can exceed customer expectations and enhance customer retention rates.

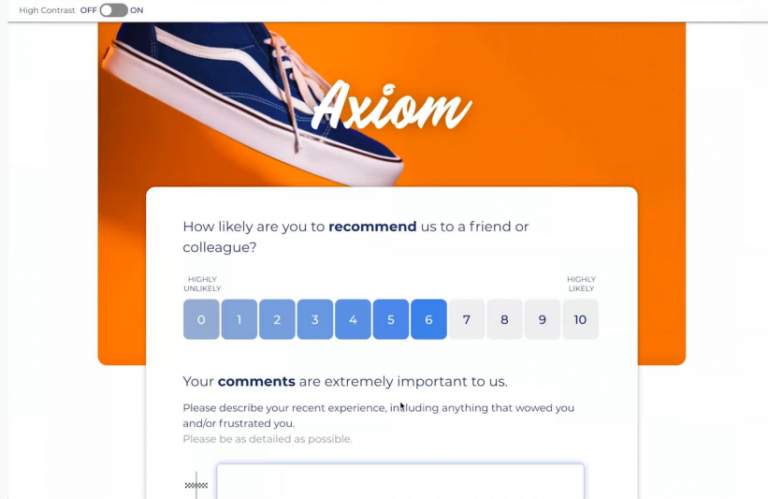
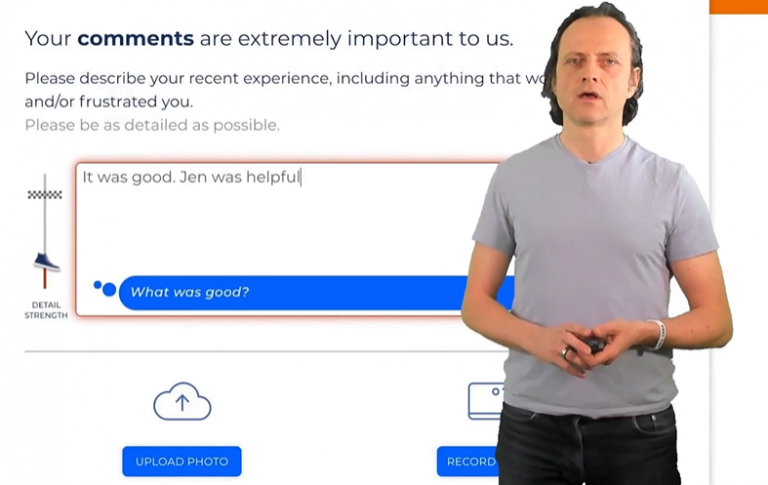
A customer experience score helps you get the average satisfaction score of the customer. For instance, in an automated survey, customers rate their specific experiences like a service call or a product purchase on the scale of “very satisfied” or “not satisfied at all.” The CX scores can fluctuate due to several reasons. Let’s discuss those reasons first.

Get your FREE hardcopy of the “CX Insights Manifesto”

FREE for all client-side Insights professionals.
We ship your hardcopy to USA, CA, UK, GER, FR, IT, and ESP.

What Makes CX Scores Fluctuating?

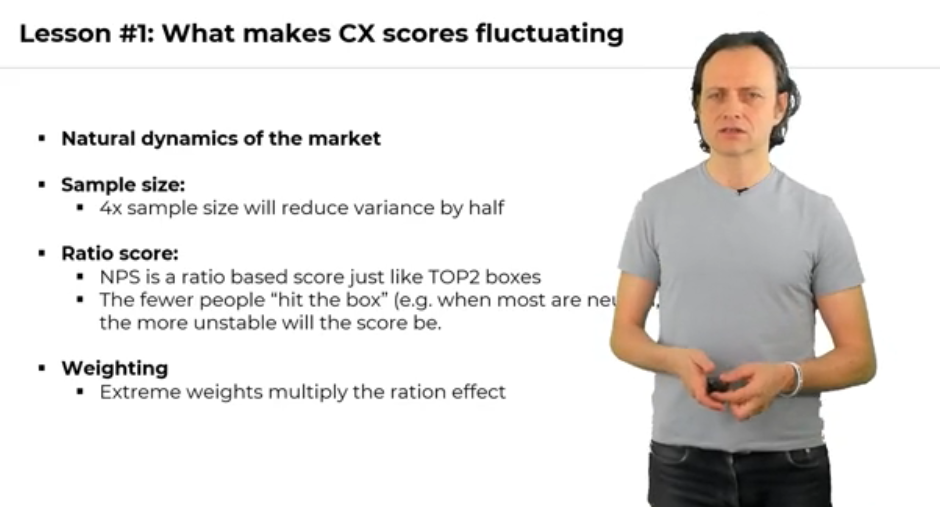
Following are the reasons due to which the CX scores fluctuate.

  • Market dynamics – The CX scores fluctuate as there is a movement in your customer experience either through the competition or what is happening in your organization. There is a natural dynamic in the market, so the CX score does not stay stable.

  • Sample Size – The noise that occurs due to the fluctuating CX scores can be huge for several reasons. The first reason is the sample size. Many people think that the CX score can become stable if the sample size is doubled. However, it is not the case. To get double stability, you need four times more i-e., 4X sample size. This way, you will reduce your variance to half.

The sample size is NOT the merit and solution to everything. Instead, we need to look at:

  • What can we do with the sample size?

  • How can we extract more information from the sample size?

  • Ratio Score – One of the noises and variations comes from the way we compute the score, especially NPS that is a ratio score and not the mean. It takes ratios of promoters, subtracts the ratios of detractors, and ratios the same way as the TOP2 boxes are very fragile towards low sample sizes. So, they have a high variance. Why is it? 

Imagine you have a sample size of a hundred, and the typical share of promoters is just 5%. So, you will expect five out of a hundred to fall into the promoters. If two are missing for some reason, you suddenly have a 40% less score in the promoter piece. 

If the same happens with the detractor, many more people are in the neutral zone. So, there will be a variation due to this small change. The scores will be largely different. As the ratio scores are always more fluctuating, so the NPS is an unstable score.

  • Weighting – Another factor that makes the CX score even worse is weighting. Many companies take their fluent or high-value customers and overweight them by the factor of 10 (let’s say). But if you have a low sample size, it is another reason for the fluctuation.

In short, weighting multiplies the ratio effect and amplifies the whole measurement problem of NPS.

What Are The Simple Tactics To Mitigate The Effect?

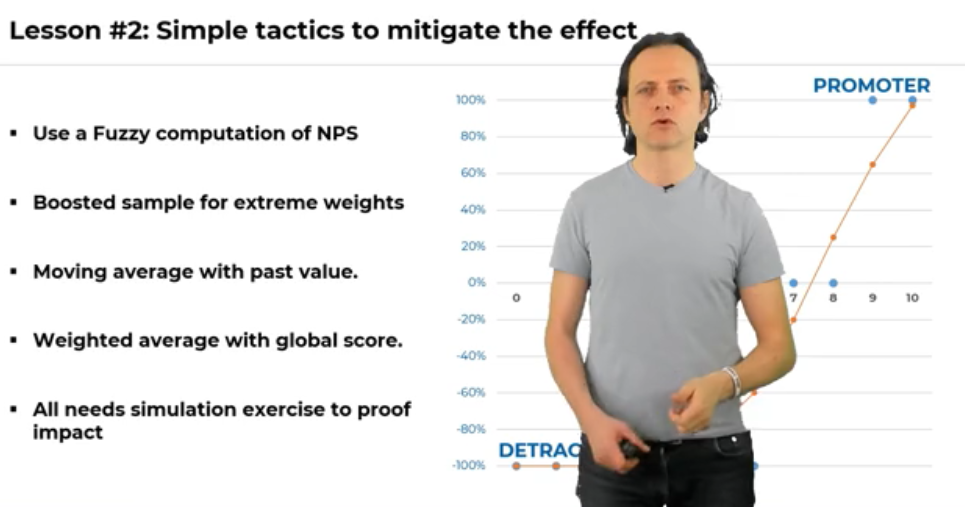
Let’s discuss some simple tactics to mitigate the effect. They are as:

  • Use Fuzzy Logic – Instead of computing the NPS, the standard way is to use fuzzy logic. It is not complicated. If you understand everything, it’s simple.

In the below chart, you can see the different scores of NPS. 

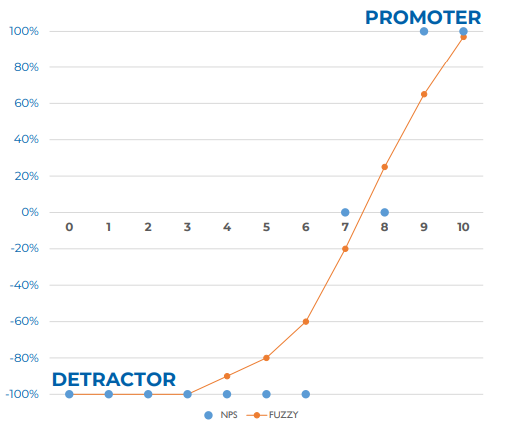
The blue points indicate how you treated the different NPS scores. If someone is six or lower (detractor), you treat them as minus a hundred percent NPS because across all the customers, you set an average and get the NPS score.

On the other hand, you treat promoters as hundred percent NPS because if everyone is a promoter, the average is hundred percent. In the seven lines, you treat them as zero. That’s basically how the NPS score calculation treats responses. It’s a binary thing i-e., bad, and good. You can use fuzzy logic and say, for instance, age is not the same as seven. It is positive neutral. 

In the above chart, seven is a negative neutral, and nine is positive but not a hundred percent, maybe 70 or so. You may ask how to know which value to take. You can assume some facts and can see if, on average, the same NPS score emerges across many different times or splits. You can try it out, and you will find those measurements that pretty much, on average, give the same NPS. But for this specific moment, it gives a different NPS because it acknowledges that seven is NOT eight, and your customers did not mean eight though you treat it the same way.

So, fuzzy logic makes more sense of what your customers are saying, but you still get an NPS score. 

  • Boost Sample – You can boost the sample. For instance, for the extreme weights or the high-value customers, you can try to boost the sample and reach more often out to them or reach a larger sample. So, you get more feedback from high-value customers. For instance, if something is double in value, you can reach out to double per person.

  • Moving Average – You can compute the moving average with the past value. Why? You may say you can not average out the new value with the old one. It would be a wrong value because neither the old nor the new value are the true values. Both are highly affected for low sample size by noise. You can filter out this noise by simply meaning them out.

  • Weighted Average –  It’s a simple technique, but if you want to use some other tactics, you can mean the noise with some benchmarks. If the general trend is upwards, there is a chance that the specific trend is also upwards.

  • Simulation Exercise – Anything you do should be simulated because you might say:

    “I can not compute the average from the old with the new value.”

    How to know that it will be better and not be worse. You only know if you do the simulation. Remember, your score is NOT the truth. It is highly fluctuating through biases, i-e., through a sample bias, through weighting, through measurement, etc.

Join the World's #1 "CX Analytics Masters" Course

What Is A Calibration Model?

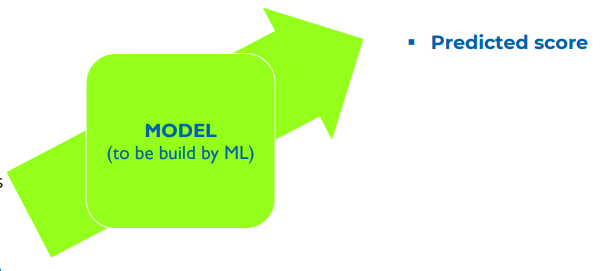
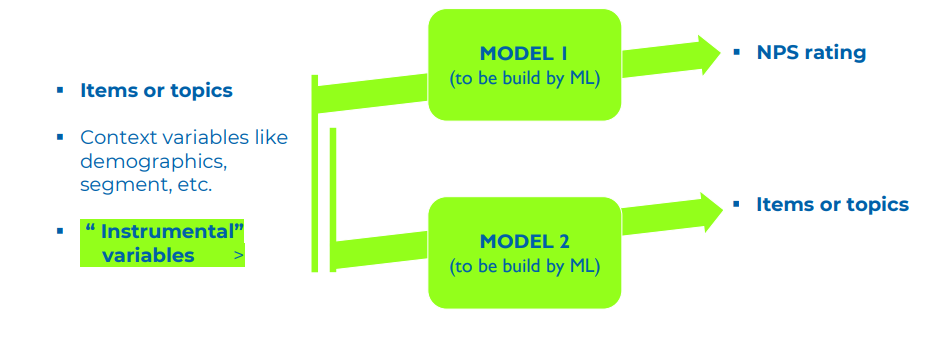
Let’s discuss how to calibrate your KPIs using modeling. Typically it is advised to use machine learning as a modeling technique because it is more flexible, has higher predictive power, and assumes fewer assumptions. The idea is that you take your score and try to predict it. For instance, you can predict the NPS score of fluent customers in Germany. Then, you can have another split like retails in Switzerland. So, whatever splits you have, you can have the score. 

Predictors –  You try to predict which score you can expect if you know its predictors. Some of the predictors are as:

  • Score last term – The first predictor is the score of the last term. There is a strong autocorrelation of scores. If there is a high loyalty in the USA, it will be the case for the next period. There might be a change, but this is the biggest information needed to predict that the score is the score of the last term.

  • Score before the last term – You can also include the score before the last term and can find out when the last time the outlier occurred.

  • Score change of other segments – You can put the change of the score in other segments. The scores in other segments are widely different. Some are high, some are low, but it does not matter for this score. But if there is a typical change in other segments, it might be predictive for the score (predicted score) as shown below. Typically, the customer serves the same product to all the segments or all regions. 
  • Score change of other regions – If there is a new product or a new service initiative, it impacts too many segments or too many regions, and typically they are correlated. The score changes for not only the segments but also for the regions.

  • Sample Size – Low sample size means a high variation or high change from past to future.

  • Mean not score – You should try using this score instead of using the score of the last term. It is because you don’t want to report the mean of the NPS. After all, it is hard to interpret for decision-makers. But actually, it is a more stable score, and we can use machine learning to translate it into the future score. That’s the beauty of machine learning, as we don’t need to know how all the predictors interrelate. Often, there are strong interactions among the scores when conventional statistics do not work at all. It typically gives half of the predictive power, so we need to leverage machine learning here.

  • TWIN splits – Average, not all others but use most correlating TWIN splits. Instead of looking at the change of all other segments, you can find out which segments typically correlate with the existing segment. You need to use the correlation matrix and find out which split correlates with the other split. So, you find TWINS, and these TWINS are to be more predictive to each other.

  • Other indicators – There might be other indicators about the splits like sales number, churn, etc. These are the real-world numbers that are the indicators of what is happening in the real world for your customers. So, whatever numbers you have, they can go into the modeling, and machine learning will find out if they are useful or not. 


CAUTION:

Not use other items of the same survey.

When you do an NPS survey, you can have items like service product, pricing, etc. You can take the average score of the segment for quality service (let’s say) as a predictor for the final score. It is a good predictor, but it will still fool you. Why? 

Imagine you have a low sample size and have fifty respondents in one split. The main reason for the fluctuation is sampling, how they fall into the NPS pockets, and weighted. The sample bias, along with the weighting bias, applies to the items like quality, product service, etc. So, if you have some strange people in the sample who screw up your score, they will also be the reason who screw up these items. You see, we cannot predict the truth, and that’s what we want to know. 

So, the above caution will help predict the scores, but it will not help predict the ultimate truth because the score is again biased. Therefore, you need simulation for the calibration modeling to find out the truth.

Speed Training LM

SPEED-TRAINING: Reinvent Your CX Analytics and Win C-Suite by Storm

Crystal Clear CX-Insights with 4X Impact of Actions

60-minute Condensed Wisdom from The World's #1 CX Analytics Course

*Book your slot now, last few seats left*

How Calibration Needs Proof Through Simulation

Whether simple or ML-based, all calibration needs proof through sampling, and given below is the method you need to use.

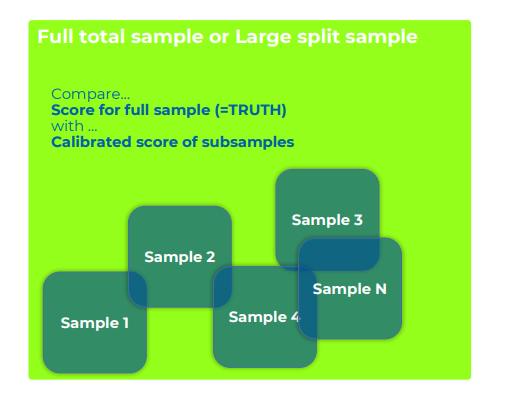
You take a split that is large enough. If you don’t have large splits, you can take the whole sample. An example of a large split is retail customers in the USA. You can do sampling with this split. For instance, if you have a 5000 or 10,000 sample score, you are pretty close to the truth. Out of this thousand or more, you can subsample now like 100, 10, 20, 30, 50. You can take out some samples and calibrate them.

You try to make the sample score better and compare it with the overall score of the sample because you know it is pretty close to the truth. 

Consider an example below.

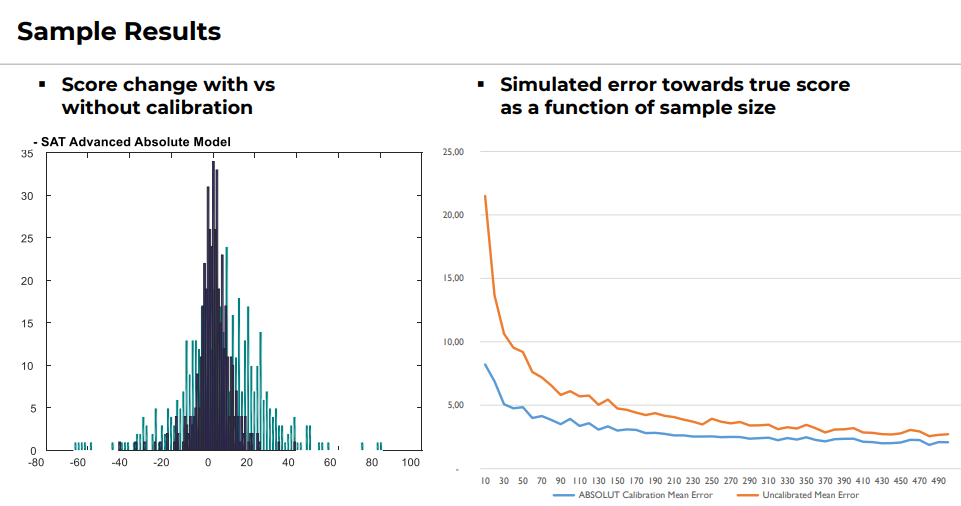
What you see on the left is the score change with and without calibration. Here the NPS score for a hundred or fewer samples variates. Typically it can vary between -20 and +20 for a low sample size. So, the calibration gets much more stable.

On the right, you can see the simulation result. The blue line indicates the sample size, and the orange line is the standard error or the deviation from the truth. There are jumps in the simulation chart if the sample size is below a hundred. Even if it is a hundred, it has a typical fluctuation of five. So, it depends on your weighting and score scheme. It can be quite high, and you wouldn’t expect that it’s so high. 

The orange line indicates the status quo, and the blue line is the calibrator. So, you learned if you have 20 or 30 respondents, the blue line can be as stable as 150. Now, you can report splits as low as 25 samples. 

You see that the calibrated line is always better than the actual line because the measurement is just a measurement. It’s an estimation and not the truth. So, we just want to calibrate it towards the truth, and the sampling exercise tells us whether or not we are on a good track.

In a Nutshell

So far, we discussed that scores built from the limited sample size strongly fluctuate around the truth. Part of the problem is the way we calculate the scores like ratio or weighting scores. Further, some easy fixes can make the score more stable. For instance, fuzzy logic can help mean out the actual versus last score.

But the most efficient and the most precise way is to use machine learning. It is the most powerful way to bring every score closer to the truth.

"CX Analytics Masters" Course

b2

P.S. Would you like to get the complete & interactive FREE CX Measurement Guidance for your business in 2021?

Simply subscribe on the free “CX ANALYTICS MASTERS” course below and enjoy the above-mentioned training guidance in its Class # 1.

“Solves key challenges in CX analytics”

Big Love to All Our Readers Around the World

IMPRINT
Our Group: www.Success-Drivers.com

Privacy Policy
Copyright © 2021. All rights reserved.

FOLLOW CX.AI

How To Avoid Telephone Interviewer Bias In CX Surveys?

How To Avoid Telephone Interviewer Bias In CX Surveys?

Founder of CX-AI.com and CEO of Success Drivers
// Pioneering Causal AI for Insights since 2001 //
Author, Speaker, Father of two, a huge Metallica fan.

Author: Frank Buckler, Ph.D.
Published on: October 19, 2021 * 5 min read

It is becoming difficult to reach the target audience using telephone interviewing. Although the systems can accommodate open-ended responses, capturing them requires interviewers to have accurate skills.

CATI stands for Computer Assisted Telephone Interviewing. Just as computers have replaced the clipboard and questionnaire in face-to-face fieldwork, CATI has replaced traditional telephone interviews. It is best to structure interviews carried out in large numbers where all possible answers have been worked out.

Get your FREE hardcopy of the “CX Insights Manifesto”

FREE for all client-side Insights professionals.
We ship your hardcopy to USA, CA, UK, GER, FR, IT, and ESP.

We will discuss the reasons and the impact of the CATI bias. First, we understand the two types of bias that are:

  • A real person – It is helpful to have a real person because people talk more with the real person. You can get more feedback, but it will be moderated and will be less extreme and explicit.

  • Transcription – The second type of bias is the transcription bias because:

  • What your customer is saying is not one-to-one transcribed. This is how 99% of the telephone interviews work today.

  • In most call centers, the interview is manually categorizing the answer in real-time. So, it is bad as they need to work under time pressure that significantly reduces failures. To categorize in real-time, you can not have more than ten categories, and with ten categories, you can do nothing specific. So, there is no mechanism to ensure that every interview takes place in the same way.

  • If the interview is manually transcribed, it will be a simplified representation of the true feedback.

  • It is nearly impossible to keep the coding among many interviewers consistent, even with good training. Let’s say if 20% of people don’t like your service, you need to know what it means. Is it waiting time? Is it friendliness? Is it the way they are approached? Is it too many cold emails? Whatever it is, you need to know what bothers them to act so you can get better. 

  • Result – The phone interviews are largely biased and simplified. That’s why when we take this kind of feedback into seeking analytics, we see entirely different results because it is simplified. If you use predictive analytics, you will get accurate results. But in this case, the predictive power is lower. You can think of a telephone interview channel as a good channel because what else could be better than having a person speaking with your customer. It’s good for your customer and good for you because you can learn what they are saying exactly. In short, you can manually listen to an active listener.

Join the World's #1 "CX Analytics Masters" Course

How To Avoid The Biases?

You can use the following techniques to avoid the CATI interview bias. 

  • Use the power of CATI interviews, which means you don’t need to apply automated active listening approaches as it is not always optimal. It’s much better to have a human, and you can affirm and clarify what the customer means by saying:

“I get you.” 

Or if you don’t comprehend anything, you can ask:

“What do you mean?”

So, these phrases of active listening have low influence in terms of what the customers will say but still probe them to talk more.

  • You need to standardize your active listening approach using prompts to avoid bias. It is better to ask questions so that the customer can elaborate, like what do you mean? Etc. So, there are some standard questions you can use and which are pretty easy to train. 

It is a MUST to replace manual transcription with:

  • The AI-powered automated transcription is available as API-based cloud services. You can transcribe many different languages your customers are saying, and it is not expensive to program.

The AI-powered categorization is available as API-based cloud services. You can categorize in real-time what your customers are saying. The same algorithm we use to categorize the feedback is real-time capable. So, you need to do this little automation to improve your feedback quality.

Speed Training LM

SPEED-TRAINING: Reinvent Your CX Analytics and Win C-Suite by Storm

Crystal Clear CX-Insights with 4X Impact of Actions

60-minute Condensed Wisdom from The World's #1 CX Analytics Course

*Book your slot now, last few seats left*

In a Nutshell

So far, we discussed that telephone interviews are significant because the quality can be very rich. There’s nothing better than having a human speaking with your customers. Using open-ends in this form is very nice, but the bias of the interviews is quite huge. So, prefer combining manual active listening with machine-made transcription and coding.

"CX Analytics Masters" Course

b2

P.S. Would you like to get the complete & interactive FREE CX Measurement Guidance for your business in 2021?

Simply subscribe on the free “CX ANALYTICS MASTERS” course below and enjoy the above-mentioned training guidance in its Class # 1.

“Solves key challenges in CX analytics”

Big Love to All Our Readers Around the World

IMPRINT
Our Group: www.Success-Drivers.com

Privacy Policy
Copyright © 2021. All rights reserved.

FOLLOW CX.AI

How To Avoid Sparse Text Feedback In CX Survey?

How To Avoid Sparse Text Feedback In CX Survey?

Founder of CX-AI.com and CEO of Success Drivers
// Pioneering Causal AI for Insights since 2001 //
Author, Speaker, Father of two, a huge Metallica fan.

Author: Frank Buckler, Ph.D.
Published on: October 19, 2021 * 9 min read

Businesses need to make complete sense of the underlying meaning in user feedback surveys. AI can help detect common patterns in CX survey comments and indicate emerging trends in customer feedback. customer is trying to express.

At first, we are going to learn how we can deal with the sparse text feedback. There are several reasons for sparse text feedback that you CAN NOT control. It is a part of your target group. 

Get your FREE hardcopy of the “CX Insights Manifesto”

FREE for all client-side Insights professionals.
We ship your hardcopy to USA, CA, UK, GER, FR, IT, and ESP.

What Are The Reasons For Sparse Text Feedback?

The reasons for sparse text feedback are as:

  • Low brand loyalty – If you have low brand loyalty, people do not talk much. On the other hand, if you have a niche product with strong brand loyalty, they will talk more because they are much more involved. So, there’s a natural bias based on your brand. 

  • Low involvement of a person – The same applies to the category. People talk more if it’s a high involvement category and talk less if it is a low involvement category.

  • Recency – The recency factor also takes effect. If something just happened, people are more involved in it as there’s been more stress recently.
  • Frequency of other requests – If there is someone who has lots to do, gets a request for feedback every day or every hour, whatever website he visits, he is prone to not participate so much and does not respond much.
  • Age and other reasons – There are some demographic factors like age, sex, etc. Some people don’t like to write as it is cumbersome for them to type on the phone or computer. All of these factors have an effect that you can hardly control because it’s part of the DNA of your customers. 

There are some reasons that you CAN control, and they are as:

  • Change order –  The first reason you can control is the order where you ask the open-end. If you ask the open-end at the end of the questionnaire with lots of close-ended items asking for feedback, people feel they have sent everything already. In short, the open-end comes AFTER other items as an add-on. If it does not, then you have to change the order.

  • Change the channel – It is a fact that people talk less and write less in online questionnaires. For instance, if there is a telephone channel where they feel more social pressure, it is impolite to say nothing. So, you may consider the channel change option if you have a problem with the sparse feedback.

  • Priming by none – If you ask for feedback in an open-ended field, the empty field makes people believe that any input is better than none. What you can do is you can give an example or even fill out an example with which you can prime.

Join the World's #1 "CX Analytics Masters" Course

How To Leverage Audio And Video Feedback?

Audio and video feedback give richer feedback as compared to text feedback. There are many studies around that, but according to the rule of thumb, 

“They give at least 2X (double) more feedback than text feedback.”

It depends on the context, and the field is very much evolving because customers get more and more used to those kinds of feedback, and they become more tech-savvy. Some years ago, a study showed that the feedback that was received by 15% of the customers doubled in the year after as more people participated.

The acceptance of giving feedback via mobile is rapidly increasing, and it will be a standard soon. It is because you can have everything with the push of a button, unlike desktops where you do not know whether they have a webcam and microphone on or muted. So, all these things are barriers, but typically they DON’T exist on a mobile phone. So, here we have a high likelihood to get feedback.

Do you know why the audio or the video feedback works? It works because it implies social pressure. So if you record something, you feel someone will listen to it. The process is as:

  • You ask for audio or video feedback, and you need to test it out to make it mandatory. There will be a lower response rate, but how much lower needs to be tested out.

  • The recording can go in real-time to auto-transcription service. You record the audio, and it goes in real-time to a service that gives you back the text. 

  • The text can be automatically translated to the core language (by use of cloud services) in which you want to use that text.

  • The text can also be run in the cloud service that reads emotions and demographics like the customer’s age from the video.

  • You can use cloud services to read emotional components from the text.

  • You can use customized cloud services to categorize the text and the topics.
What Is Active Listening?

Active listening is evolving the tech and topic methodology you should use for your open-ends. But what is active listening? It is an adaptive real-time individual response to feedback to foster customer elaborating feedback. So, you get more of it as it is much more than a pre-formulated question.

But why does active listening work? It works because of the following reasons.

  • It is a positive affirmation so that the customer as a respondent is heard. 
  • The customer feels as if there is someone who values his input. So, it primes his expectations.
  • There is a kind of social pressure if someone writes more and gives a response.

There are two different approaches or implementation examples of active listening we see in the market. They are as:

  • In-field probing – There is some probing within the open-end field.
  • Chatbot-type – This technique uses a chatbot where people answer, and it adaptively responds to them.
Speed Training LM

SPEED-TRAINING: Reinvent Your CX Analytics and Win C-Suite by Storm

Crystal Clear CX-Insights with 4X Impact of Actions

60-minute Condensed Wisdom from The World's #1 CX Analytics Course

*Book your slot now, last few seats left*

Consider an example of in-field probing below:

This example shows when people write some short text; the active listening approach pops in what’s good. A meter (as shown below) also shows how detailed your text is and primes you how good you are.

So, this is one approach to active listening, and it depends a little bit on the complexity of your inputs. It can go wrong if you wrongly categorize what has been said.

There is another chatbot type of technique that is a little bit more foolproof. So, there is an open-end, and someone writes something in it and submits it. Then, the chatbot pops up and says:

Hey, I’m a bot and I didn’t understand what you actually wrote. So, the person can write better as the bot has the option to be authentic and open. It can also ask whether it has understood the information correctly.

Even though the chatbot categorizes well what has been said, the respondents feel that it is not hundred percent true. They need to write more specifically about what they meant. So, this way, this feedback gives more power to probe for more feedback, and it is a dialogue conversation that doubles the number of topics mentioned. 

In a Nutshell

So far, we discussed that open-ends often result in scar responses, so you have to do something against it. You need to make sure that you apply standard rules to get your customers talking. Further, you need to collect audio or video feedback that can be translated into text and categorized into topics. 

Use active listening as it also applies to audio and video feedback. You should also know that better unstructured feedback is the most customer-centric way of collecting feedback, and that’s why it is really important to collect a lot of it.

"CX Analytics Masters" Course

b2

P.S. Would you like to get the complete & interactive FREE CX Measurement Guidance for your business in 2021?

Simply subscribe on the free “CX ANALYTICS MASTERS” course below and enjoy the above-mentioned training guidance in its Class # 1.

“Solves key challenges in CX analytics”

Big Love to All Our Readers Around the World

IMPRINT
Our Group: www.Success-Drivers.com

Privacy Policy
Copyright © 2021. All rights reserved.

FOLLOW CX.AI

How To Avoid And Control Selection Bias?

How To Avoid And Control Selection Bias?

Founder of CX-AI.com and CEO of Success Drivers
// Pioneering Causal AI for Insights since 2001 //
Author, Speaker, Father of two, a huge Metallica fan.

Author: Frank Buckler, Ph.D.
Published on: October 16, 2021 * 9 min read

Selection bias occurs when you are not fully capable of selecting samples without bias. The ones who are aware of their infallibility can benefit from the use of biases. Otherwise, these subconscious biases can distort statistical analysis and outcomes.

Let’s first understand what selection bias is. So, selection bias is when customers who take part in the survey are fundamentally different from those who don’t. We want to survey all possible customers who have experience with our brand. So, it might be distorted and can cause bias in the results. 

Further, the motivation to participate can be linked to what matters to the customers. It’s dangerous, and when it’s linked, the whole service or product is essential to the one who takes part in the survey.

Typically more loyal customers have a higher tendency to participate in the survey than the customers who are not loyal to your brand. It is logical as they do you a favor by answering the questions. So, you can think of a survey as an assignment about the customers’ loyalty.

Get your FREE hardcopy of the “CX Insights Manifesto”

FREE for all client-side Insights professionals.
We ship your hardcopy to USA, CA, UK, GER, FR, IT, and ESP.

When Is Selection Bias Harmful?
  • Selection bias may whitewash your descriptives like feedback and ratings based on positive feedback as they are the general result of the selection bias when people have the option to participate or not. It’s not a problem when the selection bias is constant. It can also distort the driver analysis but only if something specific happens. In general, it does not influence the harmful driver analysis outcomes.

  • Selection bias is harmful when the reason to participate is logically linked to both of the following entities:

    • The outcome metrics (NPS rating)
    • One or more selected topics

Let us consider an example in this case. Talkative people love to talk and express themselves. So, they tend to take part in the surveys as they love to talk. You can imagine that they are more likely to appreciate personal service as it’s important to them. It means if more talkative people participate, they will rate your brand higher as they have a better judgment on the surveys. Therefore, you can detect a predictive relationship between the topic of personal service and NPS.

What Are The Strategies To Reduce Selection Bias?

There are two strategies to reduce the selection bias, and they are as:

  • Increase reply rates – The higher the reply rates, the higher the percentage of ordinary people is included. So, you want to get a higher reply rate not to get just more data but also to have a more representative sample.  Following are the ways to have a high reply rate.

    • For email outreach – You can achieve email outreach by sending many emails and getting a high reply rate by more touches on them.

    • For popup/website – Your website should be eye-catching and attractive to gain the attention of the customers and get high reply rates.

    • Set incentives – Incentives are a way of improving the reply rates. If incentives are linked to your service, you can track those customers who require surveys. So, you can attract a certain subgroup of your customers if you have incentives that are NOT related to the drivers or outcomes.

    • Phone or in-person survey – You can change the modes of the surveys. For instance, there can be a phone or in-person surveys. Social pressure makes people not stay quiet. But it sounds a bit negative. It is because people try to be polite. When they have a person speaking with them, they are less inclined to say NO.  

  • Measure bias with modeling – The second method to work on the reply rates is modeling. You can measure the bias with modeling, and you can also clean results from it and show how it works in a minute.

Join the World's #1 "CX Analytics Masters" Course

Why Comparing Detractors with Promoters is Misleading?

The promoters are your loyal customers who are most likely to suggest your services or products to others. A person most likely tries a service when it is suggested by a friend or an acquaintance instead of being suggested through promotions or advertisements. So, you need to keep your promoters happy once they are identified. 

On the contrary, detractors are the customers who are dissatisfied with your services or products and are most likely to give negative feedback. So, you need to improve their experience to avoid a domino effect of bad referrals.

We need an approach to find out which topics are important. So, the first thing we may think of is comparing promoters with detractors. This is because we as humans learn by correlating concepts and ideas. So, we compare promoters with detractors as we are interested in finding the difference between the two. However, different problems arise when we try to find the difference between the two, and they are as:

  • Problem#1 – Wrong Signals: While comparing promoters with detractors, we try different things to see whether or not an impact evolves. We assume that there is a causal reason that may help us in finding the difference, but there’s a large risk that it can give wrong signals. It’s because it is a correlation exercise and not causation. In causation, there is a causal relationship between the two topics or concepts. However, the two concepts correlating doesn’t necessarily mean that one causes the other. So, correlation is not causation.
  • Problem#2 – Lack of Differentiation: There always exists a lack of differentiation because every topic correlates. It means that we relate the topics so much that we are unable to find the difference between the two. Both of the topics differ, but a high correlation prevents us from knowing that. For instance, when we compare promoters with detractors, we may find that every positive feedback is often in the detractive group as well as the promoter group. 

  • Problem#3 – Wrong Directions: Due to large correlation, everything seems to be equally important, so it really becomes hard to find the key. Consequently, we may get wrong indications or directions regarding the difference between the topics. For instance, it’s not always the case that promoters give positive feedback on your products or services, and the same goes for detractors.
What Is a Proper Reply Rate?

You may ask what a proper reply rate is. The right answer for you is the more the reply rate, the better it is. It is because the reply rates for industries and the customers are very different i-e., they can be 10%, 30%, etc.

So, it depends on the context. But when you ask scientists what a proper reply rate is. They guarantee you to have at least 70% of the reply rate that is unbiased and representative. But in reality, it is impossible. The only way is to have people knocking on doors, calling them, so you reach everyone you want to reach. It’s not only an expensive exercise, but also it may be the case that some customers do not like it. Therefore, it’s typically unrealistic. In short, you need to live with the bias, and you should always consider cleaning the data with analytics.

Speed Training LM

SPEED-TRAINING: Reinvent Your CX Analytics and Win C-Suite by Storm

Crystal Clear CX-Insights with 4X Impact of Actions

60-minute Condensed Wisdom from The World's #1 CX Analytics Course

*Book your slot now, last few seats left*

How To Control The Bias With Modeling?

Let’s discuss how to control the bias with modeling using two different approaches.

  • Hard Approach:

In this approach, you force a subset of clients to answer i-e. by sending survey emails, calling them, and following up again. So, it is a one-time exercise where you have a subset, and you have to make sure that you get over 70% on this subset.

Whether or not the customer belongs to the subset is stored in a binary instrumental variable to compare the subsets’ results.

It can be a one-time effort to check whether the customer belongs to the subset or not.

  • Soft Approach:

You can also control the bias with modeling using a soft approach where you force people to answer as you don’t have a normal approach. But you alter the way of enforcement when you typically send out two emails to your customers. So you have some people that you sent just one email and some that you sent two, three, and so on. This way, you have a variety of customers and pressure.

You can stalk a subset of customers with more emails.

You can store the number of emails sent in an “instrumental” variable. If it’s not email, it can be phone calls that can be stored in a variable.

In short, the soft approach is meant to be ongoing, and the hard approach is a one-time exercise where you want to compare and measure the bias. 

So, the data needs to go into modeling where you have drivers and outcomes. In modeling, you aim to find a formula or a model that can predict outcomes with drivers. For instance, NPS rating is the outcome, and the drivers are the items if you have a close-ended questionnaire or topics if you have an open-ended questionnaire. 

You can have context variables like demographics, segments, etc., along with the instrumental variables. The modeling will find out whether you need the instrumental variables to predict the NPS rating. Again there exists a spurious correlation between the responses of different customer groups. You can avoid it by modeling that finds the distinct contribution of the instrumental variable in predicting the rating. 

Further, machine learning also comes into play as you can expect nonlinearities in the interactions between the variables. So, flexible machine learning gives you the highest predictive power in this case. 

You can use another model to predict the items/topics (drivers) using the instrumental and context variables. But why is it so? It is because you want to know the bias or the selection that influences the drivers and the outcomes. We can find the importance of the topics only if the bias affects BOTH the drivers and the outcomes. If it influences ONLY the outcomes, it is simply adding noise, and the same will be the results of the driver analysis when it just influences the topics.

We can use these two models to determine whether there is mutual information in the instrumental variable that predicts the drivers and the outcomes. This way, we can understand the bias and to which topics this bias applies. Sometimes, you will see that the bias is small, but you don’t need to bother anymore when you learn it. If you use the soft modeling approach, the instrumental variable will be part of the model. It means the impact of the topics/items you find will be the true impact because the bias from the selection is attributed to the selection. 

So, integrating the instrumental variable in a continuous working model will clean the model, and the driver results will be true. When you do it as a one-time exercise, you need to do this for the two models to determine if it influenced both. However, if you do this continuously, you can run any of the models. You can not know which type of bias and the instrumental variable you will have, but you can ensure that the model is cleaned.

Conclusively, if an instrumental variable influences BOTH the drivers (items/topics) and the outcomes (NPS rating), then we have biased results.

In a Nutshell

So far, we discussed that selection bias is when the reason for participation is linked to the answers. It is only harmful when biasing outcomes AND drivers. You can control selection bias with:

  • Better response rates
  • Modeling

Modeling can measure biases and clean results from them. It uses the following two approaches:

  • Hard Approach
  • Soft Approach

"CX Analytics Masters" Course

b2

P.S. Would you like to get the complete & interactive FREE CX Measurement Guidance for your business in 2021?

Simply subscribe on the free “CX ANALYTICS MASTERS” course below and enjoy the above-mentioned training guidance in its Class # 1.

“Solves key challenges in CX analytics”

Big Love to All Our Readers Around the World

IMPRINT
Our Group: www.Success-Drivers.com

Privacy Policy
Copyright © 2021. All rights reserved.

FOLLOW CX.AI

WAR FOR FEEDBACK

War For Feedback

Founder of CX-AI.com and CEO of Success Drivers
// Pioneering Causal AI for Insights since 2001 //
Author, Speaker, Father of two, a huge Metallica fan.

Author: Frank Buckler, Ph.D.
Published on: October 14, 2021 * 6 min read

Participation in the customer survey and touchpoint feedbacks has been rapidly declining for years. Not only the amount of feedback is suffering but also the quality. What’s the cause of this trend? How can we fight it? And who will win the war of feedback?

Every time I book a hotel, flight, or rental car, every time I buy a ticket for a game, every time I buy a product at some website – virtually anytime I do a business interaction, I get an ask for feedback.

It’s common sense that I don’t have time to answer all of them. Even worse, I am developing over time the habit of not even noticing those requests.

The driving trends behind this obvious picture is twofold

TREND 1 – DIGITALISATION: With digital survey tools from Qualtrics, Hotjar, to Survey Monkey, it’s a matter of a few mouse clicks and an investment of a view bugs to collect feedback and analyze it somehow.

TREND 2 – ROLE OF INSIGHTS: The first “big data” hype dates now over 20 years back. Since then, the amount of data has doubled every two years. But all this is mainly transactional data collecting along with the business processes.

What is not scaling that fast is customer feedback.

Based on this better data, many problems along the business process get optimized e.g. leveraging AI.

The miracle remaining stays the customer. What drives his behaviors and decisions? How does he perceive his experience?

Businesses release that each company typically has a major bottleneck: to better understand than everyone else the customer.

It seems that this is already common sense. The enlightenment that only better customer insights can only deliver this is trending now and in the future.

A BCG study from 2016 has asked CEO’s what the key areas for improvements are. The clear uncontested #1 was “customer insights”.

Get your FREE hardcopy of the “CX Insights Manifesto”

FREE for all client-side Insights professionals.
We ship your hardcopy to USA, CA, UK, GER, FR, IT, and ESP.

Early Movers Will Win The War

Humans are not just customers, and if they are, they are customers of hundreds of products. If customer insights remain the ultimate bottleneck, it’s clear that managing the access becomes mission-critical.

There are three frontiers you need to operate:

Enough feedback: Acquiring enough feedback from customers is the most intuitive frontier

Quality feedback: Its not enough to gather any feedback. You need to make sure that the quality is good enough to draw useful decisions from that. If you want to cut survey length, find the type of question that captures the most useful information.

Use feedback better: When feedback becomes scarce, you really need to make the most out of it. This field is the greatest sin and area for improvement of our time.

Too often, we survey customers and do virtually nothing with it. It’s not just wasteful but unethical as your customer trusted that the time they invested would be used for good.

Join the World's #1 "CX Analytics Masters" Course

The S.U.P.E.R. Framework

Here is my list of 20 tools and tactics you may want to work thru to win the war for feedback.

They center around five strategies. First, improve, focus or alter the source of feedback (S. like Source). Second, better utilized the data you collect (U. like Use). Third, provide value to your customer so they have an incentive to give feedback (P. for Provide Value). Fourth, improve the execution of every step of the process. Improvements do not sum but multiply up (E. for Execution). Fifth, use multiple or the proper channels to reach out (R. for Reach)

SOURCES

  1. Manage a customer panel: By gathering customers willing to give feedback, you can make sure you will get enough feedback when you need it. Indeed, there is a drawback in representativity that you need to trade-off. Managing own customer panels got today much simpler and less expensive than in the past with software solutions such as Survey Ninja

  2. Public Ratings: Depending on the category, there is often plenty of customer feedback already online available. There is Amazon for consumer products, Google Maps for local businesses like Car Dealers, Tripadvisor for Restaurants, G2 for Software, or Google Play for Apps. Ratings have severe shortcomings when it comes to representativity. But when you are not interested in descriptives but in what drivers the rating, this data can still be gold.

USAGE OF DATA

  1. Calibrate low sample scores with ML: CX data is gathered to compute a CX/VOC score. Too often, the sample size is so small that the score is not reported. Score Calibration takes past samples and trains a Machine Learning Model to predict the expected score. It uses two ideas:
    1. Certain information (e.g. the sum of weights of the sample) can indicate how representative the sample is
    2. If you measure CX across regions or segments, the score of other splits can serve as a predictor.
    Overall, Machine Learning can typically calibrate scores and reduce the required sample size by half. On top of this, computing, confidence bands can help socializing those results.

  2. Collect only as much as needed: For some segments, you may have plenty, and for others, not enough. It is wise to become spares with send-outs for those segments where you get more feedback than needed. Because any survey request is paid by the good-will of your clients, use it only when needed. You may need it in the future.

  3. Utilize feedback better: Why do you collect customer feedback? …to compute a score only? No, you also want to know how to improve it. Making the most out of the qualitative feedback is a must. Its also an obligation to your customer to read, understand and act on their feedback. First, you should utilize tech that categorizes verbatimes like a human. Second, you need to run Driver-AI to understand how relevant those categories are to explain the total rating. This article gives all the details about the methodology.

  4. Fixing inner loop: The inner loop is the process of referring the customer verbatim feedback to the frontline colleagues. This process needs to be designed with care. The reason for this is that the most often mentioned topics are seldom the most important ones. When you refer to feedback to someone in order to read it, he will learn the wrong things. This is because people believe the most often mentioned topics are -therefore- the most important ones. This article has all details.

PROVIDE VALUE

  1. Valuable Feedback: There are three main motivations to take part in a survey. First is to make an impact and to improve the service with feedback. Second is to feel heard. Third is to help the provider. Respondents need to feel that their feedback is heard. Ideally they want to see that the provider took action or that the feedback is truly helpful. In B2B context, where the vendor plays an essential role for the customer, response rates are often high. If you consistently give feedback on what has been done with the feedback, some companies achieve responses rates of higher than 80%. Even when this is an astronomic number for your context, providing feedback to those who gave feedback is one way to nurture the good-will of your customers.

  2. Report: One incentive you could give before the interview is the promise to come back and report what you did with all the responses. Another trick to attract respondents is to frame a survey as a self-assessment (e.g. XYZ maturity assessment) and then send an automated report after completion. Customers will then take part because to benchmark themselves and get some judgment. Measuring CX will be just a side effect.

  3. Incentives: If needed -of cause- you can think of additional incentives to participate. When choosing, always think about things that do not relate to the loyalty as a customer. If you promise $10 you will attract people who need some money or are notoriously frugal. Is this a strong bias for your sample? No? Then this is the way to go.

  4. Psychologic value: The brain runs on fun. Everything boring or cumbersome has a hard time. Think twice about how you can make your survey entertaining. Anyways, show your appreciation and gratefulness. Using an active listening technology can even achieve that customers feel better heard and understood. At CX.AI, we developed a survey plugin that actively probes after text feedback. Although (or because) it is frank about being a bot, respondents open up. Like a robot cuddle toy where people know it’s a robot, they still develop relationships with them.

EXECUTION

  1. Optimize Email Delivery Rate: Most survey invites today are still send out via email. Everyone who has spent time optimizing email outreach to prospective customers knows that there is a whole science behind this. Achieving that enough of your emails will hit the inbox of your audience is not straight forward. Your email account needs to be set up right, the time and the format is relevant, and there are certain words and characters as well as the numbers of links and pictures will make your email die in spam or other filters. In short: not just blindly use a tool and send out; hire deliverability experts to fix this.

  2. Optimize Email Open Rates: Once our email hit the inbox does not mean it will be opened. Main drivers are the subject line but also the sender name and the first line on the text body. Subject lines should be concise (1-5 words) and spark interest. A tool like NEUROFLASH can help you optimize your subject line using AI.

  3. Personalize: Any Email without greeting me with my name must be spam or phishing. That’s a table stake. Anything else that you know about your customer can be used that the email feels more custom and therefore get noticed.

  4. Be Most Efficient: If you want to measure the likelihood to recommend in a survey, why not put the rating question right in the email? Clicking onto it leads to a website where more questions may be asked. Use the most intuitive and efficient way of feedback: ask open-ended questions and let customer use their own words to describe it: either per text, audio or video feedback.

  5. Active Listening: If it gets harder to convince customers to give feedback, it becomes even more critical to get the maximal amount of information, Active Listening is a real-time technology that can understand the topics raised by a respondent and then ask a more focused probing question. It is called active listening as it feels for the respondent that someone is listening (= trying to understand) and is interested in his view (=because he asks deeper questions). The consequence is much richer feedback that has been shown to increase predictive power by 50 to 100%.

  6. Shorter surveys: Every now and then, a stakeholder comes and wants to add a question. Fast forward some years, and you end up with a lengthy questionnaire that just tortures customers.  To me, a CX survey should have a rating and an open-end (text, audio, or video), ideally an active listening probe and making sure the context of the respondent is known (segment, product history, key demographics)

  7. Mindful surveying: Every request for feedback takes a toll on customer good-will. That’s why just ask as many, and as frequently you are sure you can act on and draw actions from it. For instance, a sophisticated structure is to have a yearly (or low level continuing) general survey, but then doing spot-light studies to understand specific areas in much more detail. E.g. if the general survey revealed that ‘uncomplicated complaint handling’ is a key, then a spotlight should explore what actually ‘uncomplicated complaint handling’ could mean in real life.

REACH

  1. Multiple channels: Most feedback is requested over email. Another 30 of companies still use the phone. But there are even more channels available like texting, social DMs. The best reach you achieve by trying it all together as each customer prefers different channels. Yes, each channel has its bias, but there are ways to debias the measure. If you want to win the war for feedback, you need to tackle this.

  2. Use frontline: A great way to achieve more feedback is to let the frontline ask for it. They do not need to collect the feedback but ask for their willingness to provide it. Who says no to a ask for 1-minute feedback?

  3. Predictive surveying: Using customer master data and eventually transactional data you can somehow predict how likely someone will follow a survey feedback invitation. Typically you can eliminate send-outs by 70% or more and still get the same sample size. Yes, they might be biased. But this bias again can be controlled by modeling. If you want no longer to spam your customers with survey invite request (from which 99% will not be followed), then this is worse exploring.

Winning the war for feedback requires investing in ‘Starwars’ tech, not in spears and catapults.  The S.U.P.E.R. framework gives you five areas to work on and dominate the ‘battlefield’ for human feedback:

Keep Yourself Updated

On the Latest Indepth Thought-Leadership Articles From Frank Buckler

Your Ultimate Masterplan

First, expand the source of feedback. Blending different sources of feedback will be the new normal. Debiasing measures have become a new science.

Second, better utilized the data you already have. As feedback becomes more valuable, it is crucial to utilize data better. I see HUGE potential here.

Third, provide value to your customer, so they have an incentive to give feedback. The way you plan your CX program tells a lot about how customer-centric you are.

Fourth, improve the execution of every step of the process – from email send-out to survey design. Improvements do not sum but multiply up.

Fifth, use the right or multiple channels to reach out and invest in predictive outreach.

If you want to dive into more cutting-edge CX thinking, the “CX Analytics Masters” Course is for you. It’s free for enterprise insights professionals. If you are looking to discuss some of the advanced technics mentioned above, with an expert, reach out at www.cx-ai.com

Now I have a question: Was this article helpful?  Please DM me directly with any comments or questions

Frank 

"CX Standpoint" Newsletter

b2

Each month I share a well-researched standpoint around CX, Insights and Analytics in my newsletter.

+4000 insights professionals read this bi-weekly for a reason.

I’d love you to join.

“It’s short, sweet, and practical.”

Big Love to All Our Readers Around the World

How To Build And Maintain A CodeBook That Fits Your Needs?

How To Build And Maintain A CodeBook That Fits Your Needs?

Founder of CX-AI.com and CEO of Success Drivers
// Pioneering Causal AI for Insights since 2001 //
Author, Speaker, Father of two, a huge Metallica fan.

Author: Frank Buckler, Ph.D.
Published on: October 9, 2021 * 7 min read

Building a codebook is an important step in the management of a data analysis project. Especially when you deal with unstructured qualitative data, you need to find the proper solution to categorize it, and use the reliable analytics within your organization.

Apparently, unstructured data appears chaotic at first glance, but with new forms of AI data analysis, it can be tamed to solve business problems.

First we look at how to set up a codebook correctly.

Get your FREE hardcopy of the “CX Insights Manifesto”

FREE for all client-side Insights professionals.
We ship your hardcopy to USA, CA, UK, GER, FR, IT, and ESP.

How To Set Up A CodeBook Correctly?

Be granular and think about actions – There are various types of coding. Manual coding and supervised coding require the human to build a codebook, and there are some do’s and don’ts around that. Of course, it depends on the use case, but in general, the recommendation needs to be granular and you have to think about the actions.Therefore, it’s not enough to have a code that is correct. It should also be useful and it becomes useful if you are more specific. It’s okay to categorize something as “poor quality”, but it would be good to know how to improve this quality. So, granularity is the king and growing a narrative translates into actionability.

Always have codes with the direction – It means that the code itself has the sentiment. Why? It’s because you can have codes like price and quality. But when people actually read it, they don’t know how to understand that. When you build categories, always construct them in a way that they have a direction like bad pricing, good pricing, bad quality, and good quality. This way, everyone who reads it, understands what it means when you say quality and price. So, it becomes an exercise, and later it enables you to detect granularities by having direction-based codes.

Be mutually exclusive – It means make sure when you choose a certain category, the other one can’t be the same. For instance, friendly service is not mutually exclusive with great service. You have to understand that one specific verbatim belongs to only one category. There is no doubt whether or not it belongs to. If you are not clear, write a description consisting of one or two sentences as it helps the coder to remember the real meaning. But if you can’t describe it, that’s probably not a good piece of code.

Cluster categories in category groups – You have to cluster categories in category groups to define a hierarchy as it enables you to have overview summaries. You can group the categories by classifying them into different clusters like the parent category and the child category. The important thing is to train the child of the specific category.

Label as customers speak – You have to be specific when you label a certain category. Typically, we tend to use general terms that are hard to understand. So, you have to be descriptive and use the language of the customer for the below reason:

  • First, you will better understand what it means and AI will understand it better too because the latest AI is not just the grouping of categories, it really looks at what’s the label of the group. What does it mean? Is it associated with the content of the verbatims? So, that’s why the label itself is important for supervised learning.

Use AND + OR when labeling – Sometimes, you have certain categories, and they can not be differentiated from one another. For example, brand, great brand, reputed brand are hard to differentiate from a customer’s point of view. It is important to use AND and OR the right way when you have certain categories. AND means the customer mentioned both categories, and OR means the customer mentioned one of them. It is necessary to give these details to the person who reads the label as well as the AI the correct guidance.

OTHERS category – What’s very much used are OTHERS category. The only use of it is to count how much we did not categorize specifically. But, it should only be used for manual coding because there are two reasons for that:

  • You risk to confuse the AI as it’s such a broad thing, and is trained to find something as a link between something to something specific.
  • When you do that, it may work somehow, But you will not be able to leverage the feature whether category or AI suggests to you the topics. It’s super important to understand that AI knows what it doesn’t know. It can only be managed if you do not use another category.

Non-informative categories – The non-informative categories are those that don’t belong to our codebook. Typically, customers may say:

“I gave it zero because I don’t recommend it in general.”

You need to pay attention to what the customer says because it helps you explain the outcomes. 

Minimum frequency per category – There is a question:

What’s the minimum frequency of a category?

It depends on the usage and it’s something you need to decide. You always build categories and open a new category if it’s mutually distinctive to something that is already mentioned in the other categories. At the end of the exercise, you can still decide to skip some of the categories.

Join the World's #1 "CX Analytics Masters" Course

How To Find New Categories?

Manual Coding – For manual coding, you have to read all comments. You build your codebook, and when new data arrives, you need to categorize everything from scratch and look for new categories. You also code everything that doesn’t fit to your codebook and visit the OTHERS category to find the new categories.

Unsupervised Categorization – It always finds new categories but changes the definition of the old ones. Therefore, it does not maintain consistency. So, if you can find a software that can fix your old ones, it may be able to find the new categories without changing the old ones.

Supervised Categorization – Supervised learning is trained by a domain expert. So, it needs humans to find the new categories, but there is a trick called smart sorting ( smart categorization). It sorts the verbatims in a way that you can be quite sure about them i-e., you will be sure what is the quality, and what is the price etc. So, supervised learning can help you detect new topics or categories very quickly and easily by getting rid of the OTHERS category.

Speed Training LM

SPEED-TRAINING: Reinvent Your CX Analytics and Win C-Suite by Storm

Crystal Clear CX-Insights with 4X Impact of Actions

60-minute Condensed Wisdom from The World's #1 CX Analytics Course

*Book your slot now, last few seats left*

How To Manage The Code Consistency?

Unsupervised learning – You know that unsupervised learning finds new categories by retraining and does not maintain consistency. You need to avoid retraining and find a tool that can fix category definitions. 

Manual Coding – How can you manage consistency in manual coding? 

  • Do not change coder – The biggest problem is changing the coder (human). It’s because the other person will code differently than the actual coder resulting in errors. During categorization, the coder goes into a learning process from the beginning to the end. So, another coder will have a different learning style and it creates problems. Therefore, you need to stick to one person for managing consistency. 

  • Do intensive hand-over – When you change the coder, you need to think of intensive hand-over. 

  • Gold Standard – The gold standard is to have a team of persons who code redundantly. Always have two persons categorizing the same stuff and they must have the ability to validate themselves.

  • Supervised AI – You can use supervised learning as your second order. If the person trains the AI, it will be the second order that can maintain the consistency of the code. 

  • Maintain Category Definitions – You need to explicitly write down what is the verbatim that belongs to the category, and what is the verbatim that does not belong to the category.

  • Small Codebook – You need to keep your codebook smaller than 100 codes if possible because of several reasons. The main reason is that the code receiver finds it hard to find the right code. So, the larger the code, the more likely you will be making mistakes in categorizing.

Supervised Categorization – The same thing applies for supervised learning because the training process involves manual coding. Focus on quality coding and make sure you train the machine right, so it will be consistently correct. In short,

  • Supervised learning is the same as manual coding.
  • Each time you train the AI, it might be a slightly different model.
  • Backward categorization with recalibration can cater both needs. You train the new AI and feed the past datasets to the new model. You will see that the frequencies and the categorization of the past verbatims are a little bit different. You can adjust and recalibrate the frequency scores. You can find the factor, so that the frequencies of the past verbatims remain the same, and you can simplify the recalibration factor for the new verbatims.
How To Deal With Multiple Languages?

If you are an international company, you have multi-language feedback. The question is how are you dealing with that? How are you categorizing it?

Native Coders – We need native people or native coders who can take a look and categorize. It’s because that is the best you can do as they are the best source to understand what the verbatim means.

  • Alignment – The question is how do you make sure that the categories are not really the same but are understood the same. There are some differences between languages. For instance, there are some words in German that don’t even exist in English, and the other way around. So, it’s impossible to have a hundred percent match of understanding between languages. 
  • Impractical for more than three languages – I would recommend you not to use this exercise of native coders if you have more than three languages. It is because those native coders really need to communicate and make sure that they understand all categories the same way. 

Translate first into core language – The alternative approach is to take all verbatims and translate them into one core language. You may think that you lose information.

Yes, you do. But you have one understanding of categories, and one native quarter categorizing everything. 

  • Use DEEPL.com – There is tech available that is much better than Google Translate. You can use DEEPL.com that supports twenty-four languages. 

So, if you have multiple languages (more than three), you can use this method as it gives better results than native codes. 

In a Nutshell

So far, we discussed that you need to build and maintain a codebook because it is important in managing a data analysis project. The following are the steps of building a codebook:

  • Be granular
  • Have a direction
  • Be mutually exclusive
  • Cluster categories
  • Label as customers speak
  • Use AND + OR when labeling

Further we discussed that you can find new categories by using the following categorization schemes:

  • Manual Coding – It reads all comments and avoids OTHERS category.
  • Supervised Categorization – It finds new categories but does not maintain consistency.
  • Unsupervised Categorization – It requires a smart categorization feature.

You can manage consistency in these methods by practicing some necessary steps. Further, you can deal with multiple languages by using two methods:

  • Native coders
  • Translate first into core language

"CX Analytics Masters" Course

b2

P.S. Would you like to get the complete & interactive FREE CX Measurement Guidance for your business in 2022?

Simply subscribe on the free “CX ANALYTICS MASTERS” course below and enjoy the above-mentioned training guidance in its Class # 1.

“Solves key challenges in CX analytics”

Big Love to All Our Readers Around the World

IMPRINT
Our Group: www.Success-Drivers.com

Privacy Policy
Copyright © 2021. All rights reserved.

FOLLOW CX.AI

How To Validate Text Analytics System?

How To Validate Text Analytics System?

Founder of CX-AI.com and CEO of Success Drivers
// Pioneering Causal AI for Insights since 2001 //
Author, Speaker, Father of two, a huge Metallica fan.

Author: Frank Buckler, Ph.D.
Published on: September 3, 2021 * 9 min read

A customer experience is a qualitative and emotion based experience. The companies are obsessed with turning this into a quantitative measure. Companies want to track a number whether it is a Net Promoter Score, Customer Effort or Customer Satisfaction score. Tracking a score like NPS can highlight the need to improve but the number alone can not provide the insight you need to make the improvements.

Many companies rely solely on this scoring system as they do not have time to do a thorough analysis of the feedback they receive. This is where the need for a text analytics system comes in that gathers the insights from thousands of open text customer comments.

Let’s first understand what text analytics is.

Get your FREE hardcopy of the “CX Insights Manifesto”

FREE for all client-side Insights professionals.
We ship your hardcopy to USA, CA, UK, GER, FR, IT, and ESP.

What is Text Analytics?

You can think of text analytics as the process of deriving meaning from text. It is a machine learning technique that allows you to extract specific information, or categorize survey responses by sentiment and topic. 

Companies use text analytics to:

  • Understand data such as emails, tweets, product reviews, and survey responses. 
  • Provide a superior customer experience.
  • Mine the voice of customer feedback and complaints.
  • Turn the unstructured thoughts of customers into more structured data.
  • Allow customers to provide feedback on their terms in their own voice, rather than simply selecting from a range of pre-set options.

Join the World's #1 "CX Analytics Masters" Course

How To Validate Categorization?

Now, let’s move towards validating our categorization as it is important to understand whether the categorization is correct.

The trick with Hitrates – The hitrates must be calculated the right way, and if you want to calculate whether your tech service category is correct, you can look at the hitrate. If you are categorizing none of your verbatim i-e., the verbatim belongs to none of your categories, then your hit rate is 98 or 99%, and that’s very high. 

Do you know why? It’s because you can be very sure that the likelihood that one of your codebooks is within one verbatim is very small. To have an accurate categorization, you need to look at the following grid.

Here,

  • True positive indicates the outcome where the model correctly predicts the positive class.
  • True Negative indicates the outcome where the model correctly predicts the negative class.
  • False positive indicates the outcome where the model incorrectly predicts the positive class.
  • False negative indicates the outcome where the model incorrectly predicts the negative class.

As evident from the above grid, false positive is the type one error, and false negative is the type two error. 

Alpha vs. Beta Failure – Alpha failure is also called False Positive, Type 1 error, or Producers’ risk. If the alpha failure is 5%, it means there is a 5% chance that a quantity has been determined defective when it actually is not. 

On the other hand, Beta failure is also called False Negative, Type 2 error, or Consumers’ risk. It is the risk that the decision will be made that the quantity is not defective when it really is. 

F1 score – It is the ultimate measure of consistency that takes both false positives and false negatives into account. It takes everything, weights it, measures its frequency, and comes up with the right measurements. So, F1 score is the gold standard score used in science to measure categorization quality.

But, F1 score only measures what you are doing is consistent or not. You are not sure if it’s correct. So, there is another term when we talk about validity, and that is Predictive Power.

Predictive Power – It is the measure of truth that helps you find the true categorization. The truth can be best found by determining whether or not it is useful to predict the outcomes. If you have something that is described through the category, and it has an impact in the world, we categorize it. It’s because we think it is important to drive outcomes. So, if this can predict outcomes because it was some kind of important, then it’s probably correct. 

In short, predictive power is the test to measure true categorization, and to predict and measure outcomes. So, the R2 of everything you do towards outcomes is the final measurement of whether or not your categorization is great.

Two years ago, we compared the different categorization schemes where we took lots of data and tried to compare unsupervised learning with manual coding and supervised learning. When we took it to the predictive power test, unsupervised learning achieved an R2  of 0.4. Then, we used open-source supervised learning and it was much better and much more predictive than unsupervised learning.

But it was not even close to manual coding. So we tried further and found a supervised learning approach, which we call your benchmark supervised learning approach that even exceeded the predictive power of manual coding. 

So, there is a big difference between different approaches and the field is evolving everyday, but it is important to test its power. The best is to validate its predictive power and you may ask why a machine can be better than humans. It might not always be better than a human but there are some advantages. First, you have seen that the training of supervised learning is augmented. So, the trainer itself becomes better by training because he gets feedback from the machine.

On the other hand, the sentiment of the machine is better than the sentiment of a human and when it comes to the tonality, this is what the machine can detect much better. It can find much better, and much more predictive, the tonality of the verbatim. 

In short, the supervised learning to categorize data is much better than manual coding due to the following reasons:

  • It leverages a knowledge database for sentiment codes.
  • It produces fine-grained scores instead of binary Yes/No predictions.
Speed Training LM

SPEED-TRAINING: Reinvent Your CX Analytics and Win C-Suite by Storm

Crystal Clear CX-Insights with 4X Impact of Actions

60-minute Condensed Wisdom from The World's #1 CX Analytics Course

*Book your slot now, last few seats left*

In a Nutshell

So far we discussed that text analytics is important as it can be used to improve customer experience. It can also be used to gather their feedback through which you can uncover a deeper insight. In order to validate your categorization, you need to have a concept of the following:

  • False Positives (Type one error)
  • False Negatives (Type two error)
  • F1 score
  • Predictive Power

Also, we compared different categorization schemes and concluded that automatic coding is much better than manual coding.

"CX Analytics Masters" Course

b2

P.S. Would you like to get the complete & interactive FREE CX Measurement Guidance for your business in 2022?

Simply subscribe on the free “CX ANALYTICS MASTERS” course below and enjoy the above-mentioned training guidance in its Class # 1.

“Solves key challenges in CX analytics”

Big Love to All Our Readers Around the World

IMPRINT
Our Group: www.Success-Drivers.com

Privacy Policy
Copyright © 2021. All rights reserved.

FOLLOW CX.AI

The AI-for-Insights Maturity Model

The AI-for-Insights Maturity Model

Founder of CX-AI.com and CEO of Success Drivers
// Pioneering Causal AI for Insights since 2001 //
Author, Speaker, Father of two, a huge Metallica fan.

Author: Frank Buckler, Ph.D.
Published on: 29.09.2021 * 6 min read

“What else can I do with AI” is what I have been hearing in professional insights groups recently. The number of solutions is exponentially growing, but AI has not yet affected the insights process as this might indicate.

We all have heard of text analytics or facial recognition with AI. More and more applications pop up, and it can feel crowded ….

…if you don’t have a compass, take mine.

Get your FREE hardcopy of the “CX Insights Manifesto”

FREE for all client-side Insights professionals.
We ship your hardcopy to USA, CA, UK, GER, FR, IT, and ESP.

AI Needs Us To Think Different

AI is like a magician buster. A magician does his tricks, and the outcomes are surprising. The audience doesn’t know how this could have happing. AI finds out by looking hundreds of times closely.

Whenever you have data about the input (e.g. text feedback) and data about the outcome (e.g. the themes the text fits into), you can let AI find out the missing formula that can predict outcomes with particular inputs.

The basic idea of AI is straightforward. This simple concept, however, is so different from what we are used to.

We are used to think “hypotheses”. We are used to think that we need to tell the computer what to do, how A may lead to B. We can’t imagine that algorithms can learn about complex behavioral mechanisms just without us.

Join the World's #1 "CX Analytics Masters" Course

AID Framework

Maturity comes in stages. First, kids learn to eat, run, and speak. Later, when entering teen age they can do everything an adult can do. They can be so eloquent you may believe they are adults. But cognitive maturity needs more.

In the same way maturity of AI application for insights evolve.

First, you see that AI is used to automate what a human can do in insights. Humans can categorize verbatims or tell you whether a person looks sad or happy. But a machine can be trained to do this at scale.

The second stage is to use AI for automating marketing, service, or sales activities – fulled by stage one. Again, a human can do all this too, but deploying a machine has costs, speed and quality implications.

The ultimate stage, however, is to use AI do discover insights about the link between input and output, between cause and effect. This links the information from stage one to inform stage two. Here is where the ultimate AI-insights-Loop closes.

#1 Automate insights

Most AI you know is automating what’s already here. But automation does not just mean lower costs and higher speed. As a result whole new research procedures evolve.

  • Text analytics: helps us to categorizes customer feedback. It is the process to quantifying qualitative text-based information. Today it can have the same quality as manual humanmade categorization even in more complex B2B settings. AI can even categorize the emotional side of text. It can read for instance anger, sadness or surprise. It can spot the tonality beyond the actual meaning of the words.

  • Association AI: Words are unconsciously associated with each other, like Milk and Cow. There is AI that extracts the recent associations that are implicit in public text data. This astonishingly is very close to what you can measure in Implicit Association Tests. As such, the tool can serve as a proxy. Mainly it is used where it is economically not feasible to apply IAT. Recent applications use this AI to find words and language that better resonate with your audience.

  • Facial recognition:  Based on the research of Paul Eckman there is a validated theory of how mimics can be interpreted as emotions. It includes 7 base emotions happiness, sadness, surprise, disgust, anger, fear, and contempt, plus 12 styles of joy. The machine now can even more reliably as humans read mimics and minor mimical cues from pictures and videos.

  • Voice analytics: Analyzing voice can be done today with a variety of cloud-based services. You can transcribe it into text, and you can read emotional cues in the voice. It is even possible to detect a COVID infection just by analyzing the coughing sound of a person.

  • Eye-tracking AI: Thousands of eye-tracking studies had been used to train AI models with the intention to predict eye-tracking outcomes without actual eye-tracking. It can undoubtedly be dependent on the context and the target group to where audiences look at first. But research shows that up to 90% of fixations are independent of this and actually hardwired. With this, you can analyze ads, websites, popups, or even newsletter emails before launching. It enables to faster iterate and improves the impact of assets.

  • Visual analytics: Similar base technology is used to understand the content of pictures and videos. The same way AI can be trained to detect emotions or to predict eye-tracking results, visual analytics platforms today detect by default the object a picture has, like a table, skirt, a man or clouds. Those machines can even be trained to see more abstract concepts like “stylish interior”, “pop culture”, or “a teens room”.

While all this is amazing already, the true power of AI comes with combining it with the other two stages of AI maturity.

Keep Yourself Updated

On the Latest Indepth Thought-Leadership Articles From Frank Buckler

#2 Insights into actions

There is no value in insights unless you do something useful with it. Here are some tech utilizing AI to improve marketing and sales actions

  • Chatbots: I don’t mean this cumbersome tree type question branching system that are mostly in use today. The basic use of AI in chatbots is to understand unstructured text and respond in a predefined manner. The more advanced chatbots use AI that actually mimic responses of actual humans. They are trained on hundreds of customer-agent chats and will respond to customer requests just like a typical agent. Sure this comes with limits, and it will not be able to chat on any off-topic comment.

  • Text synthesis: the GPT3 technology from Open-AI made it in the press in 2020 and led to a wave of text synthesizing services. AI today can write emails, poems and whole articles. In most cases, it still needs human review. But it has been proven to not just speed up the copywriting process but also help with ideas and inspirations. Leading applications that use GPT3 are now designed to not just produce well-written copy, but copy that works. This means emails that convert, slogans that people will remember and subject lines that make people open emails.

  • Picture and video synthesis:  Early versions of GPT4 now not only produce new texts but pictures and videos that are purely fictional. Besides the cost-saving effects (less photo and video shoots), the real power lies in the ability to teach the system to produce converting or convincing pictures.

  • Deepfake avatars videos: These are services that use a given video and change typically the face and let the person speak new arbitrary sentences. With this, you can produce very quickly explainer videos and even a video service interface, without the need to actually record a video.


Voice synthesizing: Computer-generated voice is actually a four decades-old discipline. So far it has always been rule-based and computer voice always was somehow recognizable as a computer. This changes now with AI as those flexible algorithms can inject those little imperfections that make a voice feel human.

#3 Discover insights

AI today can automate a variety of research processes, from text coding, facial reading to eye tracking. Then AI can help synthesize copy, pictures, videos, and one-on-one service interactions. 

But still, something fundamental is missing. 

Automating to read customer feedback still does not include 

Automating to read customer feedback still does not include understanding which of the customer feedback has to biggest impact when improving the matter. 

Also, to craft a good copy, I need to know what separates a “good” from a “not so good” copy. 

Any marketing and sales action relies on a simple assumption. The causal assumption is that an action will lead to a particular outcome.

AI now can help us to find those models and causal assumptions about the world that will be most impactful.

AI-powered operative learning loops

Imagine you run a weekly newsletter that drives traffic to your website and specific offers. AI can be used to optimize the conversion process in many stages. Image it increases open rates from 40 to 50%, click rates from 4 to 5%, and landing page conversion from 4 to 5%. This will result in a sales increase of 100%.

Based on enough examples, AI can not only predict which subject line, picture, and copy will convert better, it can also tell us why. 

Further, we can use AI to create subject lines, pictures, and copy at scale and use this to perform multivariate massive-scale experiments. Instead of sending all 10.000 recipients one or two versions, you can now send 500 different versions every week. 

Causal AI then can learn from the outcomes of these massive experimentations.

Causal-AI powered strategies

Besides the tactical optimization of marketing and sales process like the newsletter sent out, AI is used to understand winning strategies.

This is actually where Success Drivers has specialized in for more than 10 years. We helped T-Mobile to build a winning go-to-market strategy. We found the right product strategy for SONOS to foster growth. We enabled METLIFE to distill the winning DNA of successful advertising.

Now we are focusing with CX.AI on gaining strategic directives with AI from the customer feedback nearly every brand gathers today.

Its outcome is even used to enable proper organizational learning as feedback shouldn’t be just delivered to the frontline. Instead, it needs an AI-powered filter and sorting process to make customer-facing units draw the right conclusions.

GROW OR GO

AI is here to stay. Stage one of the maturity curve is slowly diffusing into the insights process for a few years already. New developments of AI solutions help to augment and automate customer interaction. 

All this makes the steps faster, cheaper, and more consistent. It is the ingredient to scale and to automate.

But a new quality level of insights is enabled by stage 3 of the maturity curve: applying Causal AI to understand the link between actions, context and results.

Technology for Causal AI is on the rise for more than 10 years. It is still waiting for its breakthrough simply because it is the third and final stage of AI maturity.

Research leaders who understood the enabling power of Causal AI are utilizing it already successfully today. 

If you want to dive into this field, the website of the pioneers, Success Drivers is a good start: www.success-drivers.com, and of course, its core produce CX.AI www.cx-ai.com 

Now I have a question: Was this article helpful? 

Please DM me directly with any comments or questions 

-Frank

"CX Standpoint" Newsletter

b2

P.S. Would you like to get the complete & interactive FREE CX Measurement Guidance for your business in 2022?

Simply subscribe on the free “CX ANALYTICS MASTERS” course below and enjoy the above-mentioned training guidance in its Class # 1.

“It’s short, sweet, and practical.”

Big Love to All Our Readers Around the World

How To Leverage The Power Of Sentiments?

How To Leverage The Power Of Sentiments?

Founder of CX-AI.com and CEO of Success Drivers
// Pioneering Causal AI for Insights since 2001 //
Author, Speaker, Father of two, a huge Metallica fan.

Author: Frank Buckler, Ph.D.
Published on: September 26, 2021 * 5 min read

It would be best for an organization to analyze customer sentiment because it helps understand customers better and improves product experience. To analyze customer relationships better, you have to understand their feelings and the rationale behind their rating or sentiment.

Let’s understand first what sentiment is and what are its common types.

Get your FREE hardcopy of the “CX Insights Manifesto”

FREE for all client-side Insights professionals.
We ship your hardcopy to USA, CA, UK, GER, FR, IT, and ESP.

What Is A Sentiment?

By sentiment, people typically understand whether a comment, verbatim, or feedback is positive, negative, strongly positive, or strongly negative. But there are other understandings of it. It’s important to understand because if you build a codebook, it already has some sentiment as part of the code. For instance, the sentiment of a codebook indicates the good quality and bad quality of the code.

So, sentiment is an inherent part of a category definition. It has the power to measure the ROI (Return on Investment) of marketing campaigns and help organizations improve their customer service. It also gives businesses a sneak peek into their customers’ emotions so that they can be aware of the crisis. But you can understand the sentiment differently too. It depends on what kind of sentiment algorithms you use.

Sentiments can also be the tonality of a comment. Do you know what tonality is? You can think of it as the difference between a positive and negative experience. It can also be the difference between a lost customer or a lifelong relationship. You can understand tonality with the help of an example given below:

Suppose an XYZ customer complains about the missing feature in your product with a positive tonality and says:

“Your great product can be improved by using this (xxx) smart feature.”

You see that the customer gave a negative comment but it’s very positive. So, tonality is a type of sentiment that helps customers connect with your brand and encourages them to support your business – only if it is positive.

Join the World's #1 "CX Analytics Masters" Course

How To Classify Sentiments?

Apart from tonality, the other types of sentiments are as follows:

  • Emotional Coding – It is a type of sentiment that scores verbatims on the following seven universal emotions:
    • Anger
    • Fear
    • Disgust
    • Happiness
    • Sadness
    • Surprise
    • Contempt


There are some softwares and APIs you can use to categorize which emotions certain verbatims belong to, and what probably the emotions are that trigger those verbatims.

  • Associational Coding – It is the type of sentiment that scores your verbatims to what terms the language is associated with. It can be useful to uncover insights for branding. Artificial Intelligence can help in finding which other terms the verbatim is associated with. 

For instance, if a customer says straight to the point that:

“Your service is crap.”

It is a very masculine way to comment and is a dominant statement. Dominant AI can detect the dimensionality of hundreds of terms and determines what your verbatim belongs to. It’s useful when you use verbatim collected in the branding space so that you can look behind the words to understand the complete meaning.

AI-powered tools like Neuroflash mirror what people think and determine how customers perceive or claim a brand’s content.

Keep Yourself Updated

On the Latest Indepth Thought-Leadership Articles From Frank Buckler

In A Nutshell

So far we discussed that sentiment is an indicator that measures how customers feel about a certain product or service of an organization. It also helps brands discover the reason why customers leave some negative feedback. Sentiment can also measure the tonality of a comment. Further, we categorized the sentiments into the following types:

  • Emotional coding
  • Associational coding


"CX Analytics Masters" Course

b2

P.S. Would you like to get the complete & interactive FREE CX Measurement Guidance for your business in 2022?

Simply subscribe on the free “CX ANALYTICS MASTERS” course below and enjoy the above-mentioned training guidance in its Class # 1.

“Solves key challenges in CX analytics”

Big Love to All Our Readers Around the World

IMPRINT
Our Group: www.Success-Drivers.com

Privacy Policy
Copyright © 2021. All rights reserved.

FOLLOW CX.AI

How To Avoid Benchmarking In CX?

How To Avoid Benchmarking In CX?

Founder of CX-AI.com and CEO of Success Drivers
// Pioneering Causal AI for Insights since 2001 //
Author, Speaker, Father of two, a huge Metallica fan.

Author: Frank Buckler, Ph.D.
Published on: September 21, 2021 * 8 min read

While benchmarking can be a powerful tool for comparative analysis and understanding best practices, it can also lead to bad conclusions if the wrong information is compared.

But first, you need to understand what benchmarking is. It is a process to measure the performance of a company’s services, products, or processes against those of another business considered the best in the industry. 

Benchmarking is a simple and five-step process as shown by the following points:

  • Choosing a service, product, or internal department to benchmark
  • Determining organizations, you should benchmark against
  • Gathering information on their internal performance or metrics
  • Comparing the data to identify gaps in your company’s performance
  • Adopting the processes and policies in place within the best-in-class performers

Get your FREE hardcopy of the “CX Insights Manifesto”

FREE for all client-side Insights professionals.
We ship your hardcopy to USA, CA, UK, GER, FR, IT, and ESP.

Why Do Business Partners Ask For Benchmarking?

In the previous blogs, we discussed how to collect customer experience data and how to analyze it. Further, we saw how to quantify unstructured feedback and gain insight and use it in a dashboard interface to help the businesses draw the right conclusions. 

Sometimes, there comes the request to do some benchmarking. Why? It’s because most companies are used to it as business partners ask them to do it. So, if you present numbers to the marketing department of C-suite, they immediately think of:

  • Is it good?
  • Is it bad?
  • Do you have benchmarks?

Let’s talk about the perceived benefits of benchmarking, as it is an important topic to talk about.

  • We benchmark as it provides an easy answer to the question :
    • Are we doing good or bad?
    • Do we still have the potential to improve?
  • Benchmarking gives you relief when you are performing relatively well or even better than the best-in-class performers. You feel good when you do a great job and feel best when you hear that you are wonderful among all competitors in the industry.

  • Benchmarking gives you directions to meet competitive performance. It sets the goal that you achieve a competitive level or somehow exceeding it is the way to go.
Why is Benchmarking Dangerous?

In my opinion, benchmarking is very dangerous, and it provides the wrong incentives. You may be in a situation where you need to offer that. But what are the right alternatives? You may, over time, be able to offer alternatives instead of benchmarking. Why? Because it is not helpful for the business. So, benchmarking assumes the following:

  • You have the same type of customers
  • What’s important for your customers is important for competitive customers as well.

The best competitor is clearly pushing the limits.

Let’s see what the risks of benchmarking are.

  • False Signals Risk – It signals that everywhere there is a gap, you need to perform better. You need to understand what is important and what you should do to improve yourself. 
  • Wrong Benchmarking – It’s due to serving different customer segments. For instance, it is dangerous to compare apples with oranges because you will get the wrong signals. Both of these fruits belong to different classes, so we can not compare them.
  • Good vs. Bad Signals – When you get wrong signals (either good or bad) by serving different customer segments, the blame game starts and is not productive. It’s because, for several reasons, the benchmark is not actually the benchmark.

Join the World's #1 "CX Analytics Masters" Course

What Are The Alternatives To Benchmarking?

Let’s talk about the alternatives to benchmarking. Consider the example below that shows two key driver canvases.

These canvases belong to the same industry i-e.,

  • YOU – It denotes the customers.
  • LEADER – It denotes the market leader.

You can see all the different topics, and the green line is just a 10% mark. Below is the competent service (written in German) in the customers’ canvas and experience at the touchpoint (written in German) in the market leader’s canvas. The positive topics of the leader are much better than those of the customers, which means that the most important mentioned topics are some way better than for us. Interestingly, it is the case for 95% or more topics in which the leader is better.

Do you think this is the case only here? According to the research of Professor Byron Sharp from Ehrenberg-Bass Institute:

“The NPS and the frequencies of the items are better for the market leaders.” 

If you look at benchmarking, you will need to level up everything the customers have. They have just a handful, maybe four or so items, that are comparable to the leader. So, it’s questionable if this is a real benchmark.

You also see that the leader’s key drivers and key leakages are different from those of your customers. So, there is a strong indication that you have attracted a different breed of customers.

The above example shows that benchmarking doesn’t lead you to good information. If you want to improve your customer experience, look at your key driver canvas, and it will tell you how to become better. It may be useful when attracting other customers as you understand what the pain points or hidden drivers of the competition are. So, you can attract them with the right marketing. But, remember that the market leader canvas is for marketing and the other one is for customer experience management. 

So, benchmarking itself is not needed as it is not a descriptive exercise. It can not tell you what’s important and what’s not. It can only tell you where you are better and where you are worse.

My recommendation is:

  • Know what’s important as it’s enough.
  • Stop blame game with arbitrary targets.
  • Constantly challenge yourself and establish a “The sky’s the limit mindset.” It’s because with benchmarking, you only address or look at where you are bad in, but it would make much more sense to take certain criteria and excel by getting much better than the competition. You don’t have to look back. Instead, you have to look forward. 

Therefore, there is no reason for looking at the competition. Look at your customers because:

You have to serve your customers, not your competition. 

Here’s a nice quote:

“Look In The Mirror. That’s Your Competition.” 

So, do not benchmark as it sets the wrong incentives.

Keep Yourself Updated

On the Latest Indepth Thought-Leadership Articles From Frank Buckler

In a Nutshell

So far, we discussed benchmarking can benefit you by providing guidance. It can also direct you where to focus. It can only be helpful if it provides the right signals. The right signal tells you where you have the potential to improve and what is important to improve. So, if this can be met by benchmarking and circumstances can be justified, you can apply it. 

Further, we discussed the alternatives to benchmarking and concluded that it does not lead to improvements. It is a non-productive exercise that provides you with the wrong signals.

"CX Analytics Masters" Course

b2

P.S. Would you like to get the complete & interactive FREE CX Measurement Guidance for your business in 2021?

Simply subscribe on the free “CX ANALYTICS MASTERS” course below and enjoy the above-mentioned training guidance in its Class # 1.

“Solves key challenges in CX analytics”

Big Love to All Our Readers Around the World

IMPRINT
Our Group: www.Success-Drivers.com

Privacy Policy
Copyright © 2021. All rights reserved.

FOLLOW CX.AI