Founder of CX-AI.com and CEO of Success Drivers // Pioneering Causal AI for Insights since 2001 // Author, Speaker, Father of two, a huge Metallica fan.
Author: Frank Buckler, Ph.D. Published on: October 16, 2021 * 9 min read
Selection bias occurs when you are not fully capable of selecting samples without bias. The ones who are aware of their infallibility can benefit from the use of biases. Otherwise, these subconscious biases can distort statistical analysis and outcomes.
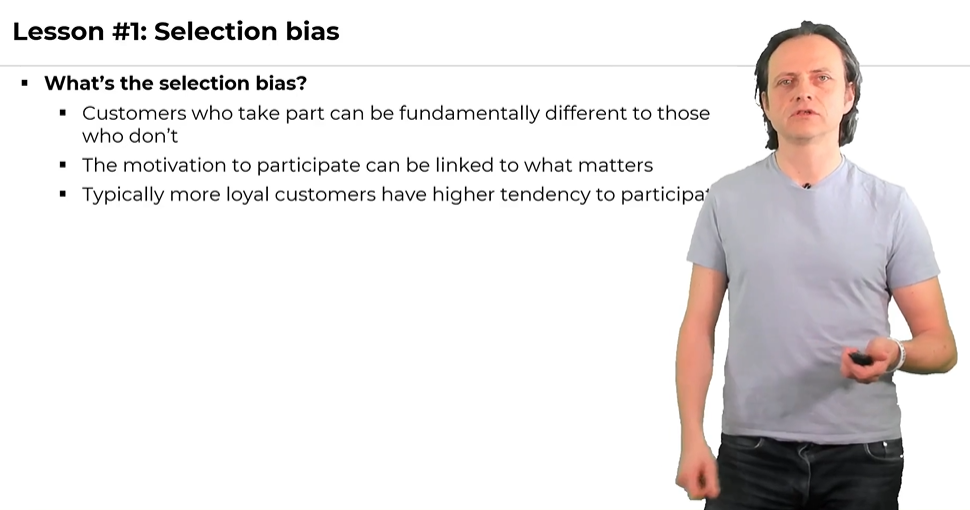
Let’s first understand what selection bias is. So, selection bias is when customers who take part in the survey are fundamentally different from those who don’t. We want to survey all possible customers who have experience with our brand. So, it might be distorted and can cause bias in the results.
Further, the motivation to participate can be linked to what matters to the customers. It’s dangerous, and when it’s linked, the whole service or product is essential to the one who takes part in the survey.
Typically more loyal customers have a higher tendency to participate in the survey than the customers who are not loyal to your brand. It is logical as they do you a favor by answering the questions. So, you can think of a survey as an assignment about the customers’ loyalty.
Get your FREE hardcopy of the “CX Insights Manifesto”
FREE for all client-side Insights professionals. We ship your hardcopy to USA, CA, UK, GER, FR, IT, and ESP.
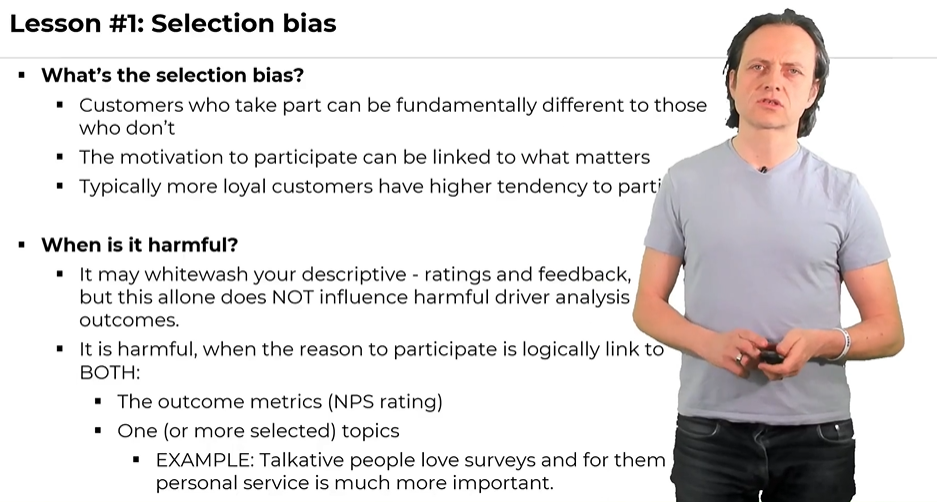
Selection bias may whitewash your descriptives like feedback and ratings based on positive feedback as they are the general result of the selection bias when people have the option to participate or not. It’s not a problem when the selection bias is constant. It can also distort the driver analysis but only if something specific happens. In general, it does not influence the harmful driver analysis outcomes.
Selection bias is harmful when the reason to participate is logically linked to both of the following entities:
The outcome metrics (NPS rating)
One or more selected topics
Let us consider an example in this case. Talkative people love to talk and express themselves. So, they tend to take part in the surveys as they love to talk. You can imagine that they are more likely to appreciate personal service as it’s important to them. It means if more talkative people participate, they will rate your brand higher as they have a better judgment on the surveys. Therefore, you can detect a predictive relationship between the topic of personal service and NPS.
What Are The Strategies To Reduce Selection Bias?
There are two strategies to reduce the selection bias, and they are as:
Increase reply rates – The higher the reply rates, the higher the percentage of ordinary people is included. So, you want to get a higher reply rate not to get just more data but also to have a more representative sample. Following are the ways to have a high reply rate.
For email outreach – You can achieve email outreach by sending many emails and getting a high reply rate by more touches on them.
For popup/website – Your website should be eye-catching and attractive to gain the attention of the customers and get high reply rates.
Set incentives – Incentives are a way of improving the reply rates. If incentives are linked to your service, you can track those customers who require surveys. So, you can attract a certain subgroup of your customers if you have incentives that are NOT related to the drivers or outcomes.
Phone or in-person survey – You can change the modes of the surveys. For instance, there can be a phone or in-person surveys. Social pressure makes people not stay quiet. But it sounds a bit negative. It is because people try to be polite. When they have a person speaking with them, they are less inclined to say NO.
Measure bias with modeling – The second method to work on the reply rates is modeling. You can measure the bias with modeling, and you can also clean results from it and show how it works in a minute.
Why Comparing Detractors with Promoters is Misleading?
The promoters are your loyal customers who are most likely to suggest your services or products to others. A person most likely tries a service when it is suggested by a friend or an acquaintance instead of being suggested through promotions or advertisements. So, you need to keep your promoters happy once they are identified.
On the contrary, detractors are the customers who are dissatisfied with your services or products and are most likely to give negative feedback. So, you need to improve their experience to avoid a domino effect of bad referrals.
We need an approach to find out which topics are important. So, the first thing we may think of is comparing promoters with detractors. This is because we as humans learn by correlating concepts and ideas. So, we compare promoters with detractors as we are interested in finding the difference between the two. However, different problems arise when we try to find the difference between the two, and they are as:
Problem#1 – Wrong Signals: While comparing promoters with detractors,we try different things to see whether or not an impact evolves. We assume that there is a causal reason that may help us in finding the difference, but there’s a large risk that it can give wrong signals. It’s because it is a correlation exercise and not causation. In causation, there is a causal relationship between the two topics or concepts. However, the two concepts correlating doesn’t necessarily mean that one causes the other. So, correlation is not causation.
Problem#2 – Lack of Differentiation: There always exists a lack of differentiation because every topic correlates. It means that we relate the topics so much that we are unable to find the difference between the two. Both of the topics differ, but a high correlation prevents us from knowing that. For instance, when we compare promoters with detractors, we may find that every positive feedback is often in the detractive group as well as the promoter group.
Problem#3 – Wrong Directions: Due to large correlation, everything seems to be equally important, so it really becomes hard to find the key. Consequently, we may get wrong indications or directions regarding the difference between the topics. For instance, it’s not always the case that promoters give positive feedback on your products or services, and the same goes for detractors.
What Is a Proper Reply Rate?
You may ask what a proper reply rate is. The right answer for you is the more the reply rate, the better it is. It is because the reply rates for industries and the customers are very different i-e., they can be 10%, 30%, etc.
So, it depends on the context. But when you ask scientists what a proper reply rate is. They guarantee you to have at least 70% of the reply rate that is unbiased and representative. But in reality, it is impossible. The only way is to have people knocking on doors, calling them, so you reach everyone you want to reach. It’s not only an expensive exercise, but also it may be the case that some customers do not like it. Therefore, it’s typically unrealistic. In short, you need to live with the bias, and you should always consider cleaning the data with analytics.
SPEED-TRAINING: Reinvent Your CX Analytics and Win C-Suite by Storm
Crystal Clear CX-Insights with 4X Impact of Actions
60-minute Condensed Wisdom from The World's #1 CX Analytics Course
Let’s discuss how to control the bias with modeling using two different approaches.
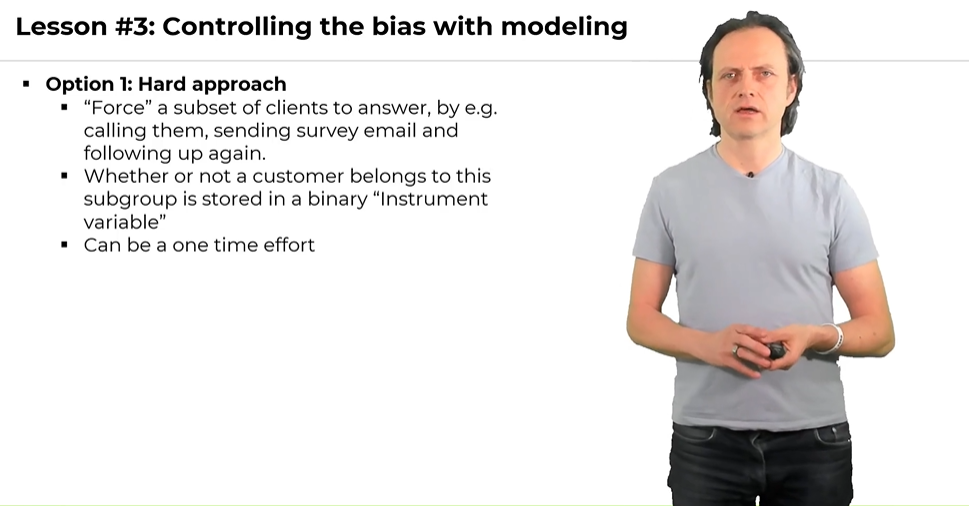
Hard Approach:
In this approach, you force a subset of clients to answer i-e. by sending survey emails, calling them, and following up again. So, it is a one-time exercise where you have a subset, and you have to make sure that you get over 70% on this subset.
Whether or not the customer belongs to the subset is stored in a binary instrumental variable to compare the subsets’ results.
It can be a one-time effort to check whether the customer belongs to the subset or not.
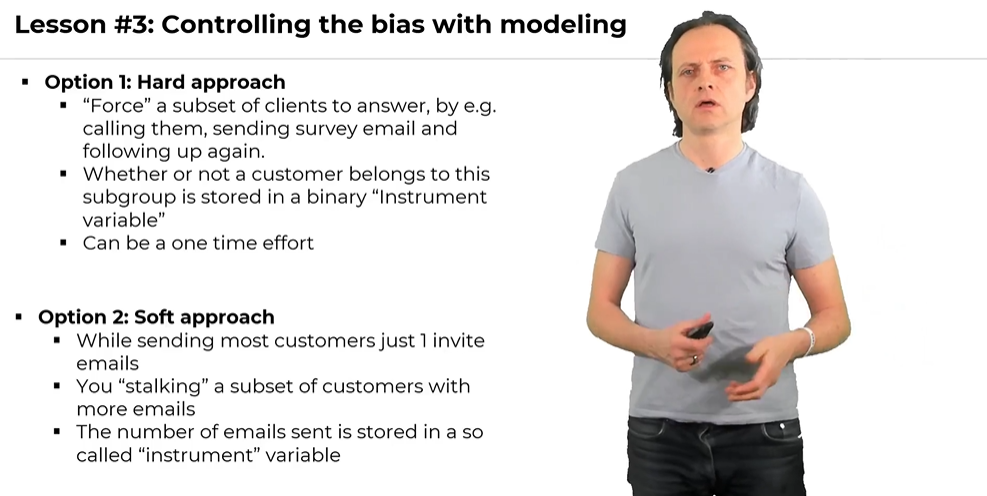
Soft Approach:
You can also control the bias with modeling using a soft approach where you force people to answer as you don’t have a normal approach. But you alter the way of enforcement when you typically send out two emails to your customers. So you have some people that you sent just one email and some that you sent two, three, and so on. This way, you have a variety of customers and pressure.
You can stalk a subset of customers with more emails.
You can store the number of emails sent in an “instrumental” variable. If it’s not email, it can be phone calls that can be stored in a variable.
In short, the soft approach is meant to be ongoing, and the hard approach is a one-time exercise where you want to compare and measure the bias.
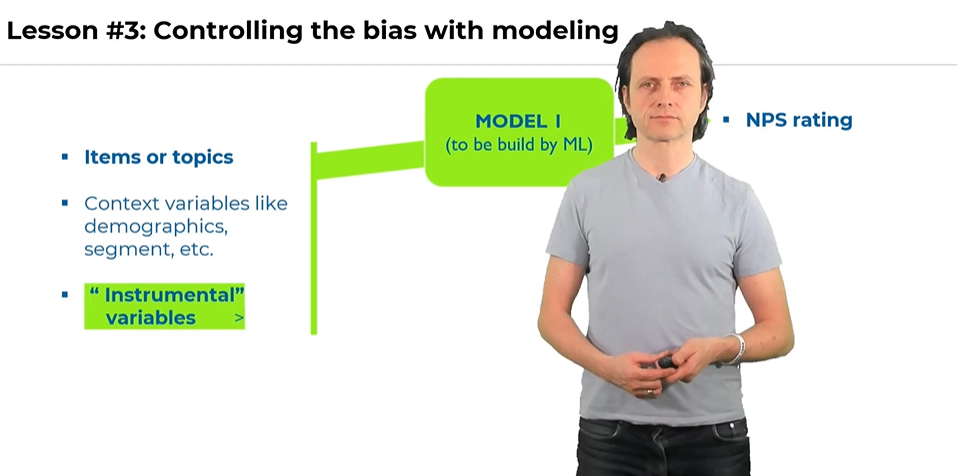
So, the data needs to go into modeling where you have drivers and outcomes. In modeling, you aim to find a formula or a model that can predict outcomes with drivers. For instance, NPS rating is the outcome, and the drivers are the items if you have a close-ended questionnaire or topics if you have an open-ended questionnaire.
You can have context variables like demographics, segments, etc., along with the instrumental variables. The modeling will find out whether you need the instrumental variables to predict the NPS rating. Again there exists a spurious correlation between the responses of different customer groups. You can avoid it by modeling that finds the distinct contribution of the instrumental variable in predicting the rating.
Further, machine learning also comes into play as you can expect nonlinearities in the interactions between the variables. So, flexible machine learning gives you the highest predictive power in this case.
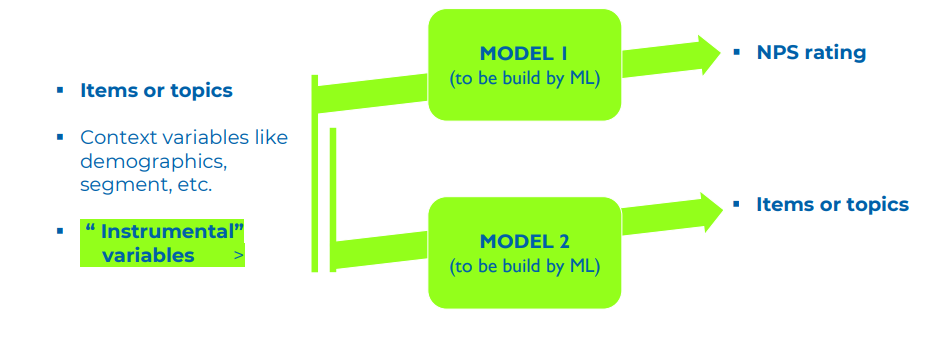
You can use another model to predict the items/topics (drivers) using the instrumental and context variables. But why is it so? It is because you want to know the bias or the selection that influencesthe drivers and the outcomes. We can find the importance of the topics only if the bias affects BOTH the drivers and the outcomes. If it influences ONLY the outcomes, it is simply adding noise, and the same will be the results of the driver analysis when it just influences the topics.
We can use these two models to determine whether there is mutual information in the instrumental variable that predicts the drivers and the outcomes. This way, we can understand the bias and to which topics this bias applies. Sometimes, you will see that the bias is small, but you don’t need to bother anymore when you learn it. If you use the soft modeling approach, the instrumental variable will be part of the model. It means the impact of the topics/items you find will be the true impact because the bias from the selection is attributed to the selection.
So, integrating the instrumental variable in a continuous working model will clean the model, and the driver results will be true. When you do it as a one-time exercise, you need to do this for the two models to determine if it influenced both. However, if you do this continuously, you can run any of the models. You can not know which type of bias and the instrumental variable you will have, but you can ensure that the model is cleaned.
Conclusively, if an instrumental variable influences BOTH the drivers (items/topics) and the outcomes (NPS rating), then we have biased results.
In a Nutshell
So far, we discussed that selection bias is when the reason for participation is linked to the answers. It is only harmful when biasing outcomes AND drivers. You can control selection bias with:
Better response rates
Modeling
Modeling can measure biases and clean results from them. It uses the following two approaches:


