


Founder of CX-AI.com and CEO of Success Drivers
// Pioneering Causal AI for Insights since 2001 //
Author, Speaker, Father of two, a huge Metallica fan.
Author: Frank Buckler, Ph.D.
Published on: October 19, 2021 * 14 min read
A customer experience score helps you get the average satisfaction score of the customer. For instance, in an automated survey, customers rate their specific experiences like a service call or a product purchase on the scale of “very satisfied” or “not satisfied at all.” The CX scores can fluctuate due to several reasons. Let’s discuss those reasons first.

FREE for all client-side Insights professionals.
We ship your hardcopy to USA, CA, UK, GER, FR, IT, and ESP.
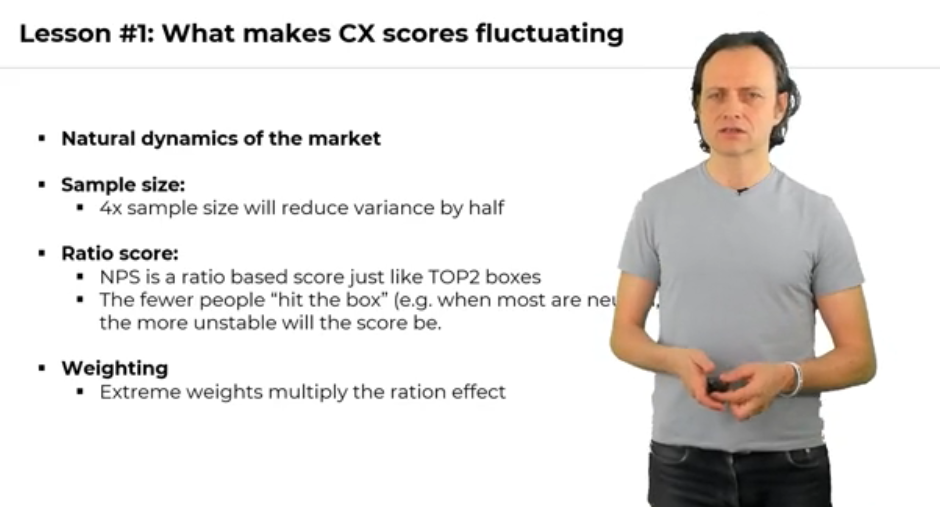
Following are the reasons due to which the CX scores fluctuate.
The sample size is NOT the merit and solution to everything. Instead, we need to look at:
Imagine you have a sample size of a hundred, and the typical share of promoters is just 5%. So, you will expect five out of a hundred to fall into the promoters. If two are missing for some reason, you suddenly have a 40% less score in the promoter piece.
If the same happens with the detractor, many more people are in the neutral zone. So, there will be a variation due to this small change. The scores will be largely different. As the ratio scores are always more fluctuating, so the NPS is an unstable score.
In short, weighting multiplies the ratio effect and amplifies the whole measurement problem of NPS.
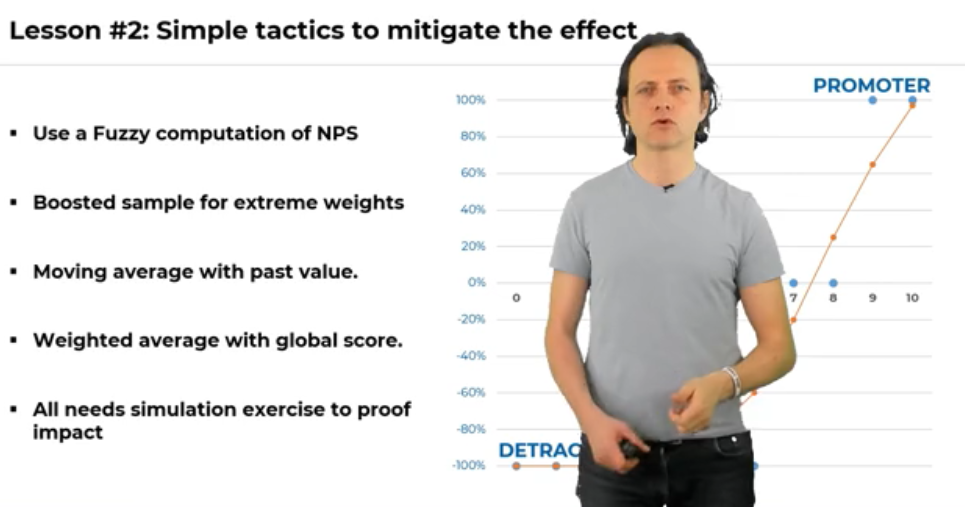
Let’s discuss some simple tactics to mitigate the effect. They are as:
In the below chart, you can see the different scores of NPS.
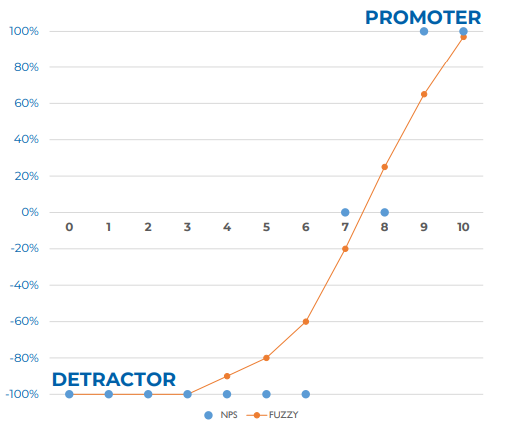
The blue points indicate how you treated the different NPS scores. If someone is six or lower (detractor), you treat them as minus a hundred percent NPS because across all the customers, you set an average and get the NPS score.
On the other hand, you treat promoters as hundred percent NPS because if everyone is a promoter, the average is hundred percent. In the seven lines, you treat them as zero. That’s basically how the NPS score calculation treats responses. It’s a binary thing i-e., bad, and good. You can use fuzzy logic and say, for instance, age is not the same as seven. It is positive neutral.
In the above chart, seven is a negative neutral, and nine is positive but not a hundred percent, maybe 70 or so. You may ask how to know which value to take. You can assume some facts and can see if, on average, the same NPS score emerges across many different times or splits. You can try it out, and you will find those measurements that pretty much, on average, give the same NPS. But for this specific moment, it gives a different NPS because it acknowledges that seven is NOT eight, and your customers did not mean eight though you treat it the same way.
So, fuzzy logic makes more sense of what your customers are saying, but you still get an NPS score.
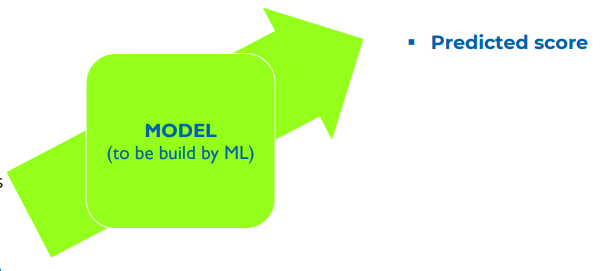
Let’s discuss how to calibrate your KPIs using modeling. Typically it is advised to use machine learning as a modeling technique because it is more flexible, has higher predictive power, and assumes fewer assumptions. The idea is that you take your score and try to predict it. For instance, you can predict the NPS score of fluent customers in Germany. Then, you can have another split like retails in Switzerland. So, whatever splits you have, you can have the score.
Predictors – You try to predict which score you can expect if you know its predictors. Some of the predictors are as:
CAUTION:
Not use other items of the same survey.

When you do an NPS survey, you can have items like service product, pricing, etc. You can take the average score of the segment for quality service (let’s say) as a predictor for the final score. It is a good predictor, but it will still fool you. Why?
Imagine you have a low sample size and have fifty respondents in one split. The main reason for the fluctuation is sampling, how they fall into the NPS pockets, and weighted. The sample bias, along with the weighting bias, applies to the items like quality, product service, etc. So, if you have some strange people in the sample who screw up your score, they will also be the reason who screw up these items. You see, we cannot predict the truth, and that’s what we want to know.
So, the above caution will help predict the scores, but it will not help predict the ultimate truth because the score is again biased. Therefore, you need simulation for the calibration modeling to find out the truth.

Whether simple or ML-based, all calibration needs proof through sampling, and given below is the method you need to use.
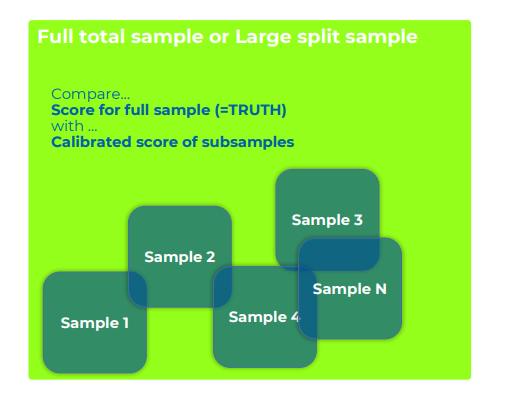
You take a split that is large enough. If you don’t have large splits, you can take the whole sample. An example of a large split is retail customers in the USA. You can do sampling with this split. For instance, if you have a 5000 or 10,000 sample score, you are pretty close to the truth. Out of this thousand or more, you can subsample now like 100, 10, 20, 30, 50. You can take out some samples and calibrate them.
You try to make the sample score better and compare it with the overall score of the sample because you know it is pretty close to the truth.
Consider an example below.
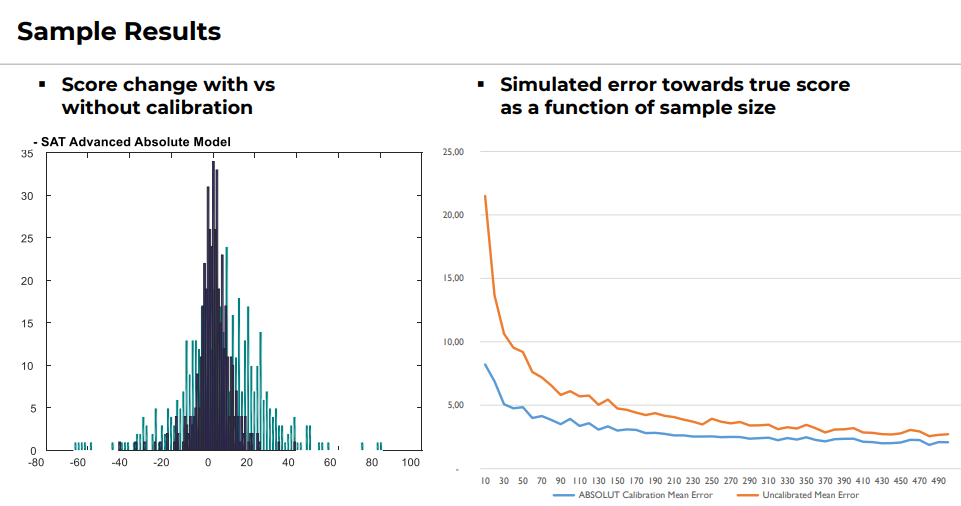
What you see on the left is the score change with and without calibration. Here the NPS score for a hundred or fewer samples variates. Typically it can vary between -20 and +20 for a low sample size. So, the calibration gets much more stable.
On the right, you can see the simulation result. The blue line indicates the sample size, and the orange line is the standard error or the deviation from the truth. There are jumps in the simulation chart if the sample size is below a hundred. Even if it is a hundred, it has a typical fluctuation of five. So, it depends on your weighting and score scheme. It can be quite high, and you wouldn’t expect that it’s so high.
The orange line indicates the status quo, and the blue line is the calibrator. So, you learned if you have 20 or 30 respondents, the blue line can be as stable as 150. Now, you can report splits as low as 25 samples.
You see that the calibrated line is always better than the actual line because the measurement is just a measurement. It’s an estimation and not the truth. So, we just want to calibrate it towards the truth, and the sampling exercise tells us whether or not we are on a good track.
So far, we discussed that scores built from the limited sample size strongly fluctuate around the truth. Part of the problem is the way we calculate the scores like ratio or weighting scores. Further, some easy fixes can make the score more stable. For instance, fuzzy logic can help mean out the actual versus last score.
But the most efficient and the most precise way is to use machine learning. It is the most powerful way to bring every score closer to the truth.
P.S. Would you like to get the complete & interactive FREE CX Measurement Guidance for your business in 2021?
Simply subscribe on the free “CX ANALYTICS MASTERS” course below and enjoy the above-mentioned training guidance in its Class # 1.
“Solves key challenges in CX analytics”
IMPRINT
Our Group: www.Success-Drivers.com
Privacy Policy
Copyright © 2021. All rights reserved.
FOLLOW CX.AI
![]()
![]()
![]()