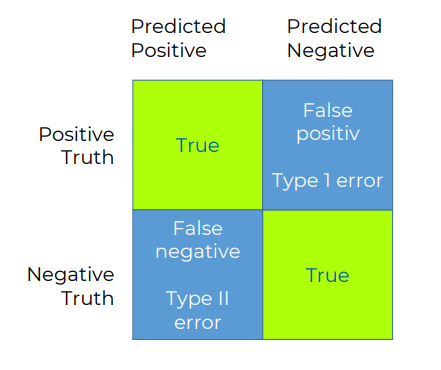
How To Validate Text Analytics System?

Founder of CX-AI.com and CEO of Success Drivers
// Pioneering Causal AI for Insights since 2001 //
Author, Speaker, Father of two, a huge Metallica fan.

Author: Frank Buckler, Ph.D.
Published on: September 3, 2021 * 9 min read

A customer experience is a qualitative and emotion based experience. The companies are obsessed with turning this into a quantitative measure. Companies want to track a number whether it is a Net Promoter Score, Customer Effort or Customer Satisfaction score. Tracking a score like NPS can highlight the need to improve but the number alone can not provide the insight you need to make the improvements.

Many companies rely solely on this scoring system as they do not have time to do a thorough analysis of the feedback they receive. This is where the need for a text analytics system comes in that gathers the insights from thousands of open text customer comments.

Let’s first understand what text analytics is.

Get your FREE hardcopy of the “CX Insights Manifesto”

FREE for all client-side Insights professionals.
We ship your hardcopy to USA, CA, UK, GER, FR, IT, and ESP.

What is Text Analytics?

You can think of text analytics as the process of deriving meaning from text. It is a machine learning technique that allows you to extract specific information, or categorize survey responses by sentiment and topic. 

Companies use text analytics to:

  • Understand data such as emails, tweets, product reviews, and survey responses. 
  • Provide a superior customer experience.
  • Mine the voice of customer feedback and complaints.
  • Turn the unstructured thoughts of customers into more structured data.
  • Allow customers to provide feedback on their terms in their own voice, rather than simply selecting from a range of pre-set options.

Join the World's #1 "CX Analytics Masters" Course

How To Validate Categorization?

Now, let’s move towards validating our categorization as it is important to understand whether the categorization is correct.

The trick with Hitrates – The hitrates must be calculated the right way, and if you want to calculate whether your tech service category is correct, you can look at the hitrate. If you are categorizing none of your verbatim i-e., the verbatim belongs to none of your categories, then your hit rate is 98 or 99%, and that’s very high. 

Do you know why? It’s because you can be very sure that the likelihood that one of your codebooks is within one verbatim is very small. To have an accurate categorization, you need to look at the following grid.

Here,

  • True positive indicates the outcome where the model correctly predicts the positive class.
  • True Negative indicates the outcome where the model correctly predicts the negative class.
  • False positive indicates the outcome where the model incorrectly predicts the positive class.
  • False negative indicates the outcome where the model incorrectly predicts the negative class.

As evident from the above grid, false positive is the type one error, and false negative is the type two error. 

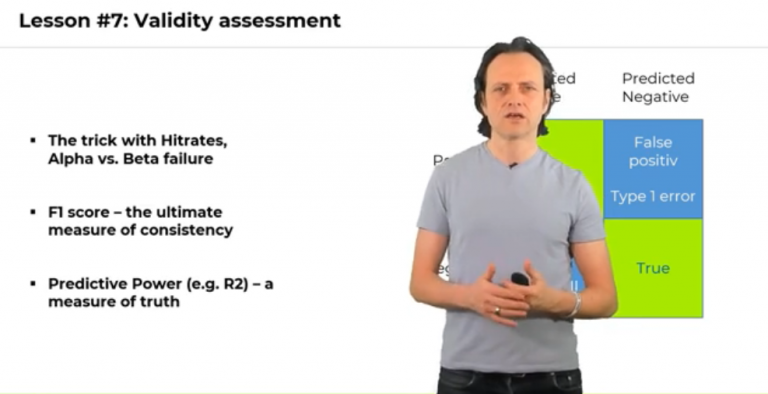
Alpha vs. Beta Failure – Alpha failure is also called False Positive, Type 1 error, or Producers’ risk. If the alpha failure is 5%, it means there is a 5% chance that a quantity has been determined defective when it actually is not. 

On the other hand, Beta failure is also called False Negative, Type 2 error, or Consumers’ risk. It is the risk that the decision will be made that the quantity is not defective when it really is. 

F1 score – It is the ultimate measure of consistency that takes both false positives and false negatives into account. It takes everything, weights it, measures its frequency, and comes up with the right measurements. So, F1 score is the gold standard score used in science to measure categorization quality.

But, F1 score only measures what you are doing is consistent or not. You are not sure if it’s correct. So, there is another term when we talk about validity, and that is Predictive Power.

Predictive Power – It is the measure of truth that helps you find the true categorization. The truth can be best found by determining whether or not it is useful to predict the outcomes. If you have something that is described through the category, and it has an impact in the world, we categorize it. It’s because we think it is important to drive outcomes. So, if this can predict outcomes because it was some kind of important, then it’s probably correct. 

In short, predictive power is the test to measure true categorization, and to predict and measure outcomes. So, the R2 of everything you do towards outcomes is the final measurement of whether or not your categorization is great.

Two years ago, we compared the different categorization schemes where we took lots of data and tried to compare unsupervised learning with manual coding and supervised learning. When we took it to the predictive power test, unsupervised learning achieved an R2  of 0.4. Then, we used open-source supervised learning and it was much better and much more predictive than unsupervised learning.

But it was not even close to manual coding. So we tried further and found a supervised learning approach, which we call your benchmark supervised learning approach that even exceeded the predictive power of manual coding. 

So, there is a big difference between different approaches and the field is evolving everyday, but it is important to test its power. The best is to validate its predictive power and you may ask why a machine can be better than humans. It might not always be better than a human but there are some advantages. First, you have seen that the training of supervised learning is augmented. So, the trainer itself becomes better by training because he gets feedback from the machine.

On the other hand, the sentiment of the machine is better than the sentiment of a human and when it comes to the tonality, this is what the machine can detect much better. It can find much better, and much more predictive, the tonality of the verbatim. 

In short, the supervised learning to categorize data is much better than manual coding due to the following reasons:

  • It leverages a knowledge database for sentiment codes.
  • It produces fine-grained scores instead of binary Yes/No predictions.
Speed Training LM

SPEED-TRAINING: Reinvent Your CX Analytics and Win C-Suite by Storm

Crystal Clear CX-Insights with 4X Impact of Actions

60-minute Condensed Wisdom from The World's #1 CX Analytics Course

*Book your slot now, last few seats left*

In a Nutshell

So far we discussed that text analytics is important as it can be used to improve customer experience. It can also be used to gather their feedback through which you can uncover a deeper insight. In order to validate your categorization, you need to have a concept of the following:

  • False Positives (Type one error)
  • False Negatives (Type two error)
  • F1 score
  • Predictive Power

Also, we compared different categorization schemes and concluded that automatic coding is much better than manual coding.

"CX Analytics Masters" Course

b2

P.S. Would you like to get the complete & interactive FREE CX Measurement Guidance for your business in 2022?

Simply subscribe on the free “CX ANALYTICS MASTERS” course below and enjoy the above-mentioned training guidance in its Class # 1.

“Solves key challenges in CX analytics”

Big Love to All Our Readers Around the World

IMPRINT
Our Group: www.Success-Drivers.com

Privacy Policy
Copyright © 2021. All rights reserved.

FOLLOW CX.AI