Founder of CX-AI.com and CEO of Success Drivers // Pioneering Causal AI for Insights since 2001 // Author, Speaker, Father of two, a huge Metallica fan.
Author: Frank Buckler, Ph.D. Published on: September 19, 2021 * 7 min read
It’s easy to recommend the CX actions from insights. But how can business partners size the relevance if there is no means to evaluate the exact impact?
In this article, we will solve this problem and show you:
How to bring transparency in the future outcomes?
How to explain past changes in NPS scores?
How to learn from the past most effectively?
Get your FREE hardcopy of the “CX Insights Manifesto”
FREE for all client-side Insights professionals. We ship your hardcopy to USA, CA, UK, GER, FR, IT, and ESP.
We can’t comprehend and evaluate a large number of scenarios and outcomes on our own. So, here comes the need for another thing handy for the dashboards, which is a simulator.
A simulator is used to access the current or predict the future performance of a business process. It helps the practitioners discover new ways to improve their business processes through statistical, mathematical, and other analytical methods. If we consider the key driver canvas, we know it shows frequency and the impact that can be high or low. But what does high impact mean? The key driver canvas has no answer to this question, so we need a simulator to understand the meaning of impact.
The simulator helps business owners to investigate the performance of their business processes. You can understand the meaning of impact using a simulator if you perform the following actions:
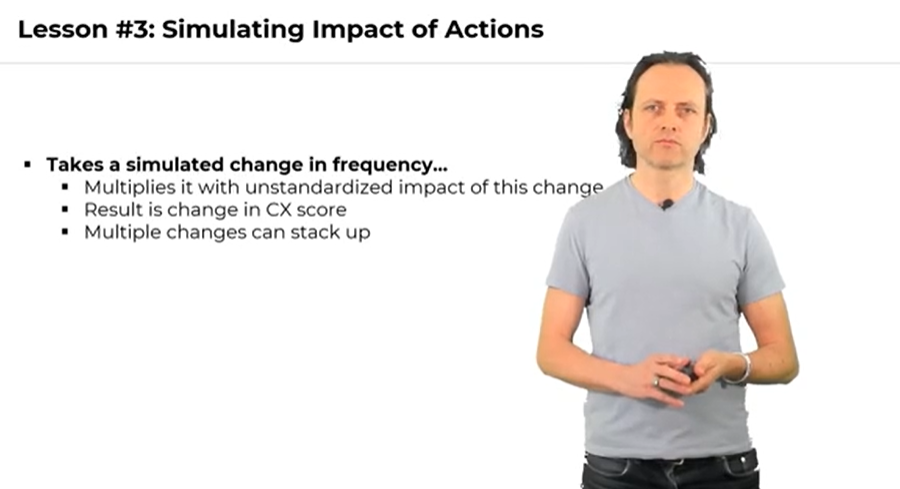
Take a simulated change in frequency – You need to wait after simulating necessary changes in the frequency.
The result is the change in the CX score – You need to multiply the unstandardized impact of the topic obtained from key driver analysis, and you will observe the change in the CX score.
Multiple changes can stack up – When you simulate several categories, you will need to stack up the inputs.
Simulation is beneficial for the business partners to understand the meaning of impact because of the following reasons:
It makes it obvious how huge your efforts are needed to get the NPS up by ten points.
It challenges you to be aspirational and to do step changes.
It is evidence-based feedback that is a motivator for businesses to set higher targets.
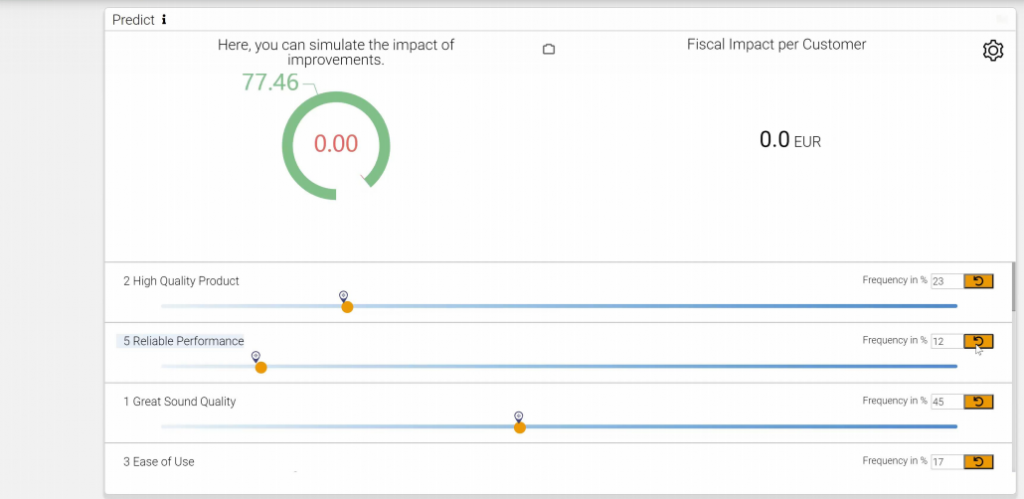
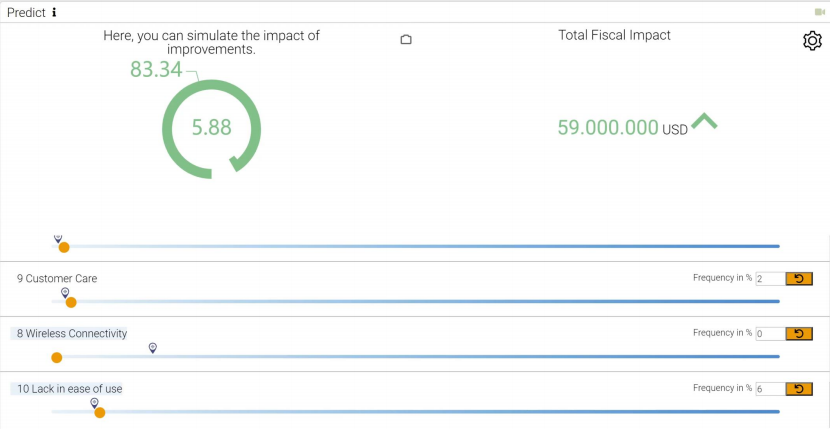
The above figure shows a simulator that looks just like a slider. When you change the important topics, the NPS changes.
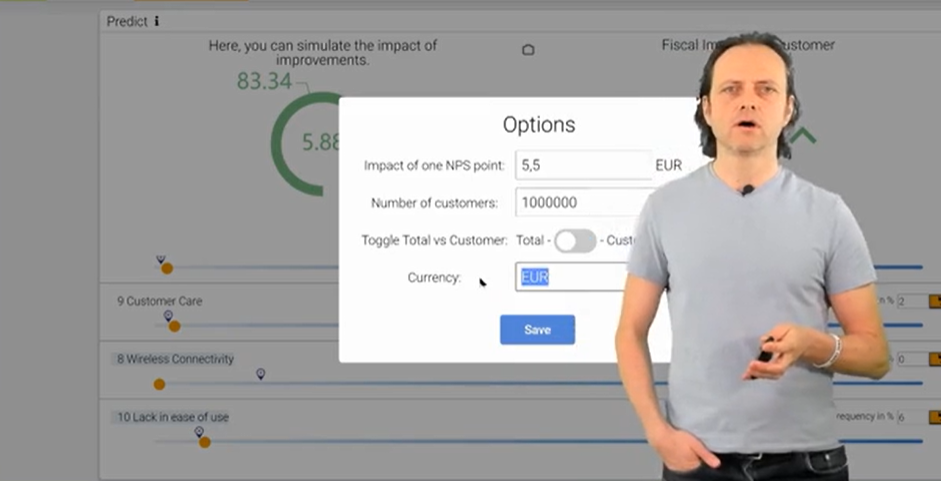
This figure shows that you can also simulate the financial impact. You can put in the number of customers that have arrived and put in the currency. Further, you also need to assume or measure the impact of one NPS point on the bottom line. Then, you can see the impact of working on one topic towards your bottom line on the simulator.
There’s another feature very useful for the companies, and that’s the topic of explaining the reasons for the score change. But the companies face the below issue:
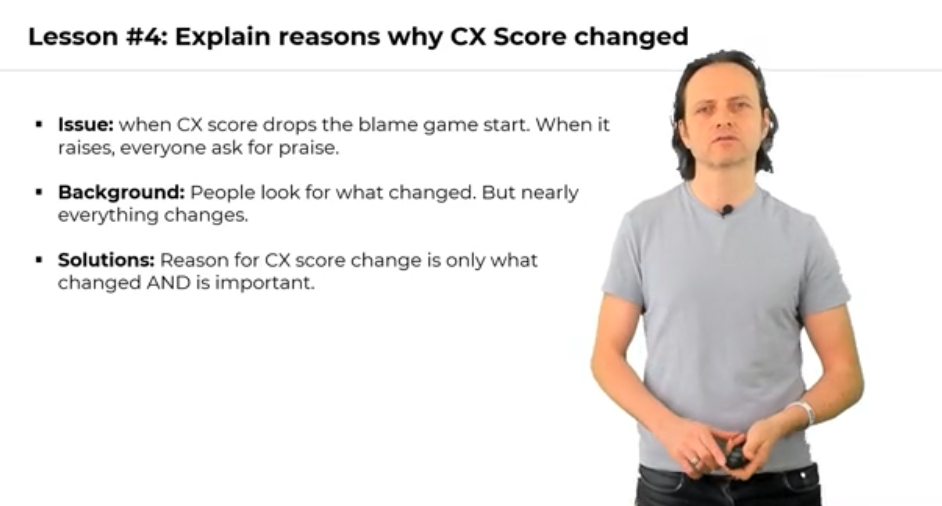
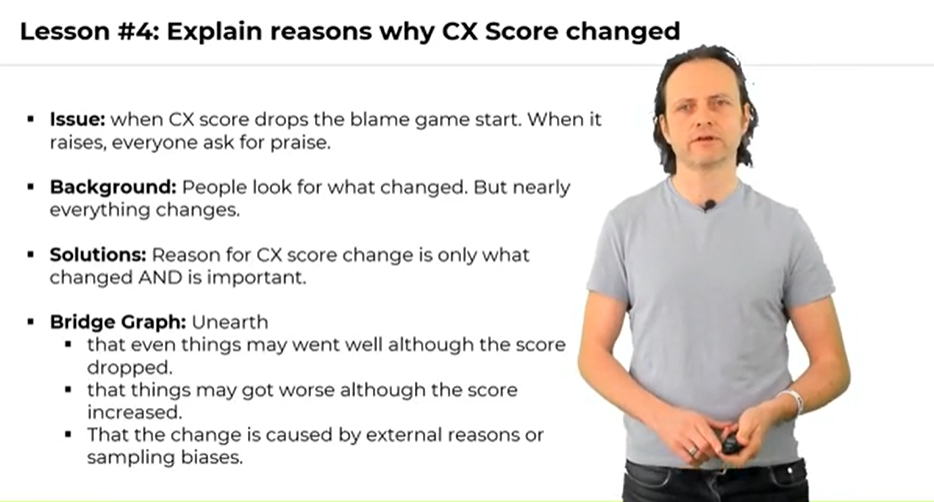
Issue – Typically, the score changes from one month or from one quarter to another. When it drops, the blame game starts. So, why did it drop, and who’s guilty of that?
Background the data has different interests. For instance, you worked on the competency of your staff. When you see the competency of your staff improved, you analyze it, shout out and say, “ This is why my project is working and showing correct results.” But this is not the way you should look at it because everyone will get different results and interpret them according to their understanding.
Solution – So, you will have dozens of different interpretations, but you need to have one evidence-based truce. You can do it by:
Evaluating the changes from one quarter to another, and
Simulating the frequency change of competency.
What does the simulator say if we improve by 2%? What is the impact if the NPS changes? To understand this, we need a simulator algorithm.
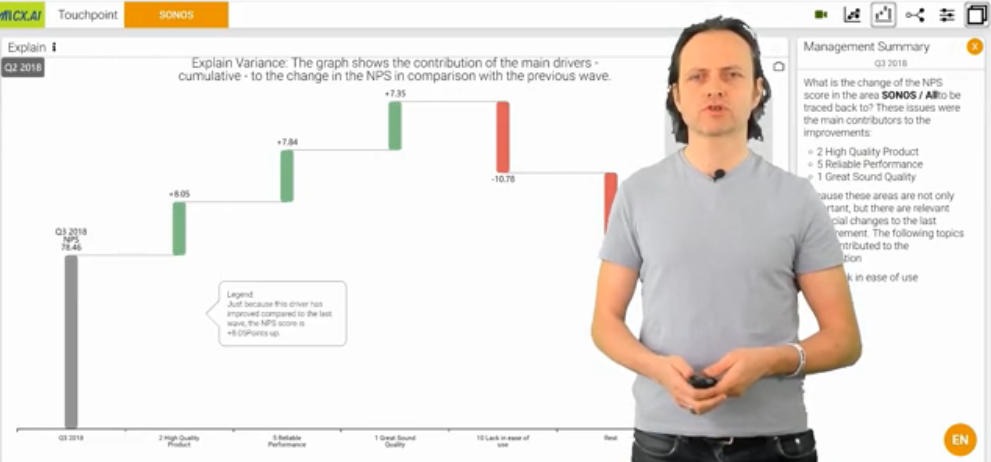
The simulator algorithm helps us evaluate the contribution of every single topic in the score change. We can add the different contributions of topics in a bridge diagram and pick up the most significant changes to the score to show them.
The diagram above shows the example of a dashboard that implements the simulator algorithm.
This is the bridge graph that shows the top contributions of the main drivers to the change in the NPS score. The main drivers are:
High-Quality Product
Reliable Performance
Great Sound Quality
The contribution of these drivers is essential, but some negative things happened, as shown by the “red” curves in the above diagram. These things have a negative impact on the NPS score change.
We can derive the following conclusions after analyzing the above bridge graph:
Some things go well even though the score drops.
Some things may get worse even though the score increases.
External reasons or sampling biases cause the change in the NPS score.
So, the impact can be positive or negative. You need not look at the outcomes and the NPS only, but you need to understand how you progressed while looking into the change in the NPS score.
Keep Yourself Updated
On the Latest Indepth Thought-Leadership Articles From Frank Buckler
We know that the key driver canvas is the core tool for communication. We discussed that we need a simulator because this makes the business partners feel the value of an action. It also challenges them to put in more effort to improve their business processes.
Further, we discussed that we need a simulation bridge to explain the past changes. So when the scores change, there’s a reason, and we saw the contribution of the top drivers in their change.


