Founder of CX-AI.com and CEO of Success Drivers // Pioneering Causal AI for Insights since 2001 // Author, Speaker, Father of two, a huge Metallica fan.
Author: Frank Buckler, Ph.D. Published on: September 3, 2021 * 9 min read
Unstructured feedback is a chance for you to immerse yourself in your customers’ feelings and thoughts towards your service or product. But without analyzing it, there is no simple way to conclude what the customer is trying to express.
What if you have thousands of NPS scores to analyze? How will you do the customer feedback analysis? How will you draw impactful conclusions from new batches every week?
One way is to read every response, but it will not be possible to read thousands of them. So, how can AI help you in automating your task to gain actionable insights? If you don’t know what to do, don’t worry. You are at the right place where I will be guiding you in the right direction.
Get your FREE hardcopy of the “CX Insights Manifesto”
FREE for all client-side Insights professionals. We ship your hardcopy to USA, CA, UK, GER, FR, IT, and ESP.
You can experience frequency illusion when the information you recently learnt, noticed or experienced crops up everywhere. It is a frequency bias that gives you the feeling everyone is talking about the subject you noticed or is swiftly swirling you. But, in actual, there is no increase in the occurrence of that subject. It’s just because you’ve started to notice it.
So, the impact-frequency illusion is just a paradox that we now ask the customers, why did you rate our product this way? We expect that they should tell us their rating criteria so that we can know and count the most often mentioned topics that drive the rating. That’s why everyone in the world counts what people are saying and then acts on it to improve their customer satisfaction levels. But, when you do the math and the analysis of how predictive the most mentioned topics and the information are in explaining what people do while giving their feedback, there arises a mismatch.
There are certain reasons for mismatch, and they are as:
Lack of incentive for deep thinking – You may be thinking about why customers consume your product. There can be multiple reasons like your product has a sound price, tastes good, has a nice appearance, and so on. But it does not mean that improving your product features will further drive your customer experience. It’s because they don’t have an incentive.
Top of mind associations – In reality, the customers don’t lie. They simply start talking. For instance, when you meet a friend and ask: How are you? He says, great So, people start talking with the initial association they have for the question. For instance, Sonos is known to be good for its brilliant wireless sound system. The food chains are good for their great services. Likewise, washing machines are good for washing. In short, we found that the top-ranked and the top-frequent topics are strong associations with the category.
Lack of awareness about own behavioral triggers – It is a post-rationalization phenomenon in which people try to explain their decision. They basically come up with a story that seems to be plausible, but they actually don’t know why they decided. For instance, humans avoid thinking that they can think. This is because thinking takes a large amount of energy, so they avoid it most of the time. There are a number of other topics as well about which people are not trained to talk about because of the lack of awareness about their behavioral triggers and bravery mechanisms. In short, they are not really aware of the factors that drove their decision.
Here the examples show that:
The top frequency categories define the category most of the time. In the above graph, the categories are shown as bubbles with their frequencies on the y-axis and impact on the x-axis. For instance, there was a new feature for Solos, called a voice assistant. But most of the clients didn’t have it. This is because it was not mentioned to them. But, it became super powerful when it was mentioned to them.
The new or low performing categories have a low frequency. So, if your products are not so good and are at a reliable performance, then, of course, they are not so often mentioned. But people may be experiencing your good reliability or be satisfied with the status your products have.
Why Comparing Detractors with Promoters is Misleading?
The promoters are your loyal customers who are most likely to suggest your services or products to others. A person most likely tries a service when it is suggested by a friend or an acquaintance instead of being suggested through promotions or advertisements. So, you need to keep your promoters happy once they are identified.
On the contrary, detractors are the customers who are dissatisfied with your services or products and are most likely to give negative feedback. So, you need to improve their experience to avoid a domino effect of bad referrals.
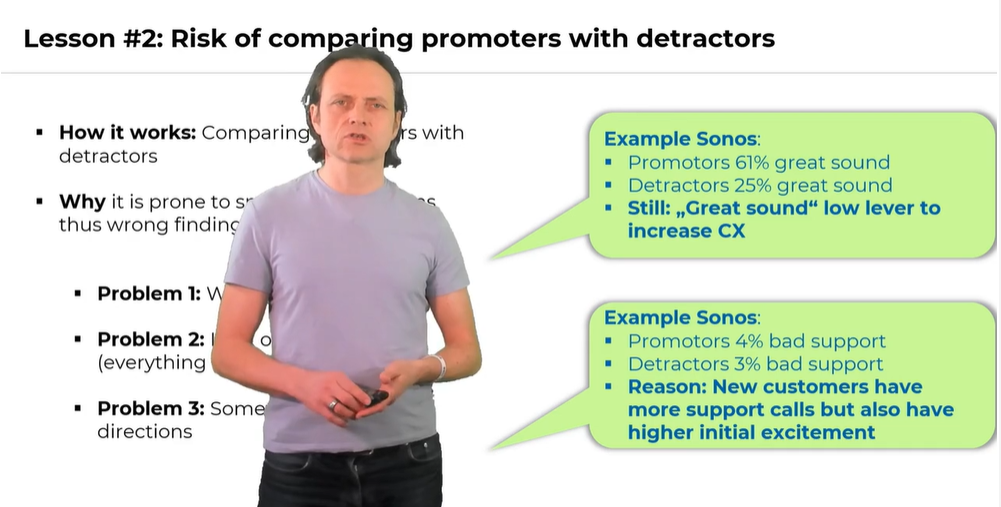
We need an approach to find out which topics are important. So, the first thing we may think of is comparing promoters with detractors. This is because we as humans learn by correlating concepts and ideas. So, we compare promoters with detractors as we are interested in finding the difference between the two. However, different problems arise when we try to find the difference between the two, and they are as:
Problem#1 – Wrong Signals: While comparing promoters with detractors,we try different things to see whether or not an impact evolves. We assume that there is a causal reason that may help us in finding the difference, but there’s a large risk that it can give wrong signals. It’s because it is a correlation exercise and not causation. In causation, there is a causal relationship between the two topics or concepts. However, the two concepts correlating doesn’t necessarily mean that one causes the other. So, correlation is not causation.
Problem#2 – Lack of Differentiation: There always exists a lack of differentiation because every topic correlates. It means that we relate the topics so much that we are unable to find the difference between the two. Both of the topics differ, but a high correlation prevents us from knowing that. For instance, when we compare promoters with detractors, we may find that every positive feedback is often in the detractive group as well as the promoter group.
Problem#3 – Wrong Directions: Due to large correlation, everything seems to be equally important, so it really becomes hard to find the key. Consequently, we may get wrong indications or directions regarding the difference between the topics. For instance, it’s not always the case that promoters give positive feedback on your products or services, and the same goes for detractors.
Consider the above examples of Sonos. In the first example, we see that 61% of promoters mention that Sonos has a great sound. Also, there are 25% of detractors who believe the same. It’s something we don’t expect from detractors as we generally believe that they always give negative feedback. But the example proves that we may go in the wrong direction. Further, the customers choose our product because they like it as it performs well. But, we should know that improving the product features doesn’t always contribute to increasing the loyalty of the customers, and it becomes clear when we do the predictive analysis.
In the second example, we see that there are 4% of promoters and 3% of detractors who give negative feedback regarding the Sonos sound system. So, why do the promoters have larger complaints about it? Does it mean bad support is good?
No, it doesn’t. Actually, the reason is that the detractors are the new customers who have more support calls as compared to promoters. They also have an initial excitement of trying a new product or a service, so they have a smaller percentage in terms of giving bad support. In short, there is a confounding effect of the new customer property that distorts the correlation and gives counter intuitive results. It does not allow you to measure the importance of service support. So, you do not need to do that.
Keep Yourself Updated
On the Latest Indepth Thought-Leadership Articles From Frank Buckler
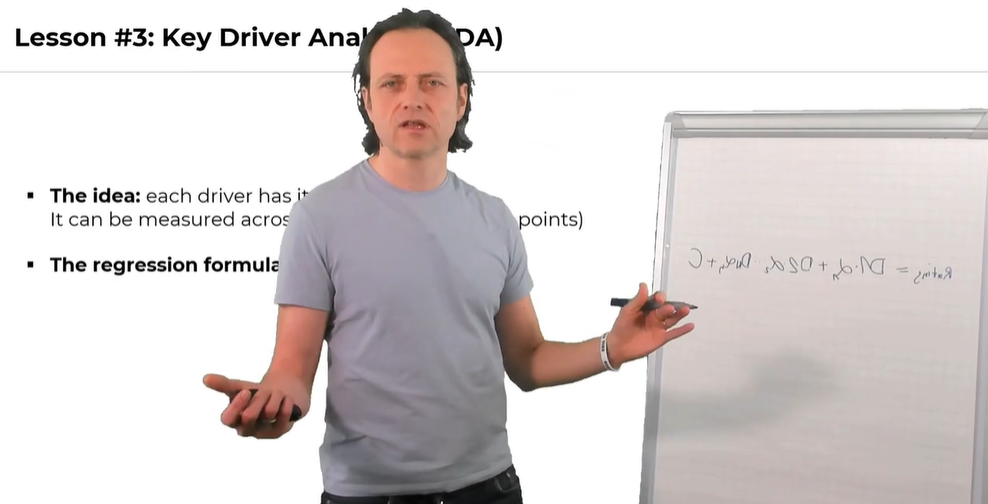
As a solution of impact frequency illusion, what we need is something like a key driver analysis. So, the basic idea of key driver analysis is that there is a set of possible drivers, and each of them has a mutual impact. It implies across a number of different responses; we can separate out a different impact of each driver.
The basic form of key driver analysis is multiple regression. Let’s suppose rating is the outcome to be predicted, so the regression formula is as:
Rating = D₁α₁ + D₂α₂ + D₃α₃ +… DNαN + c
Here D₁ denotes driver 1, and α₁ is its weight. We add another impact that causes the rating, and that is driver 2. This driver gets its respective weight α₂. In the same way, there are more drivers with their weights, and we name them DN. We also add a constant number c that has zero impact.
The driver D indicates the customer response and can be a stated quality, or a sentiment, etc., and α is the parameter. The drivers come from the survey, and parameters are found by analysis using regression to find those values of α that best predict the rating of every single respondent. The weight α has a lot of significance in the regression equation because if it becomes zero, it doesn’t matter what the customer is saying. So, the parameter is also an analogy to the impact.
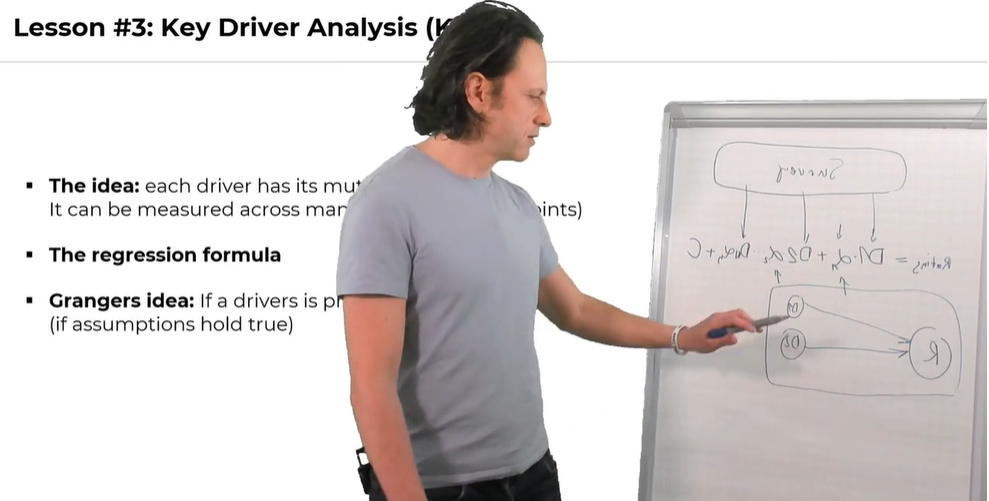
So, now you know that if the value of α1is high, driver 1 will contribute significantly to predicting the rating. Let’s have a look at the idea proposed by Granger.
According to Granger:
It means if we assume that the driver 1 and driver 2 are causing the ratingand there is nothing else influencing it, then the impact we measure is the causal impact.
For key driver regression, we have some more assumptions like:
Linearity of Drivers- It’s because a high rating will be achieved due to a certain driver when the value of its respective parameter is high. In short, the weight α assumes linearity.
Independence of Drivers – The weight α also assumes that the causal impacts caused by driver 1 and driver 2 have nothing to do with each other. They are completely independent.
Closed World – According to this assumption, no external factor or parameter other than α influences the rating.
In a Nutshell
Let’s summarize what we discussed so far. So, we have an impact frequency illusion which means that the most often mentioned topics are, most of the time, not the most important ones. That is why we need drivers. They have a mutual impact, and they are represented in terms of a regression formula. According to Granger’s idea, you can find causal to your outcome by keeping in mind the three assumptions, i-e; linearity of drivers, closed world assumption, and independence of drivers. Further, we discussed that comparing the frequency between promoters and detractors can be quite misleading as the difference can not be found due to the high correlation.
, Owner: (Registered business address: Germany), processes personal data only to the extent strictly necessary for the operation of this website. All details in the privacy policy.
, Owner: (Registered business address: Germany), processes personal data only to the extent strictly necessary for the operation of this website. All details in the privacy policy.


