Founder of CX-AI.com and CEO of Success Drivers // Pioneering Causal AI for Insights since 2001 // Author, Speaker, Father of two, a huge Metallica fan.
Author: Frank Buckler, Ph.D. Published on: September 15, 2021 * 6 min read
You need to translate your topics into valuable actions so that you can recognize and articulate precisely what you want to achieve. When the data sources are consolidated, you can gather meaningful data insights.
Do you know what actionable insights are and how you can derive them into your organization? Insight is an understanding you have about the working of your business against how you thought it would work before you accessed the data-driven insight. It makes you rethink various business factors you may not have considered before.
You can derive insights about your customers or your business by structuring and transforming your data into information that can optimize your processes and understand your customers in a better way.
Get your FREE hardcopy of the “CX Insights Manifesto”
FREE for all client-side Insights professionals. We ship your hardcopy to USA, CA, UK, GER, FR, IT, and ESP.
What is Dashboarding, Prediction And Prescription?
Let’s first understand dashboarding, prediction, and prescription before we discuss what actions to take with the help of key driver canvas.
Dashboarding – Organizations use dashboards to gain insights into the most significant aspects of their data. They gain real-time insights and competitive analysis through which they identify items that require urgent action.
Prediction – Prediction helps organizations make sense of potential outcomes or the future repercussions of a decision. It leverages historical figures and statistics and uses raw and up-to-date data to peer into a future scenario.
Prescription – Prescription also looks at future scenarios but uses a more technological approach. It takes a deeper look into the “What” and “Why” of a potential future outcome by utilizing artificial intelligence, mathematical algorithms, and machine learning.
Now, let’s look at the key driver canvas because it is the key tool to understand the main takeaways.
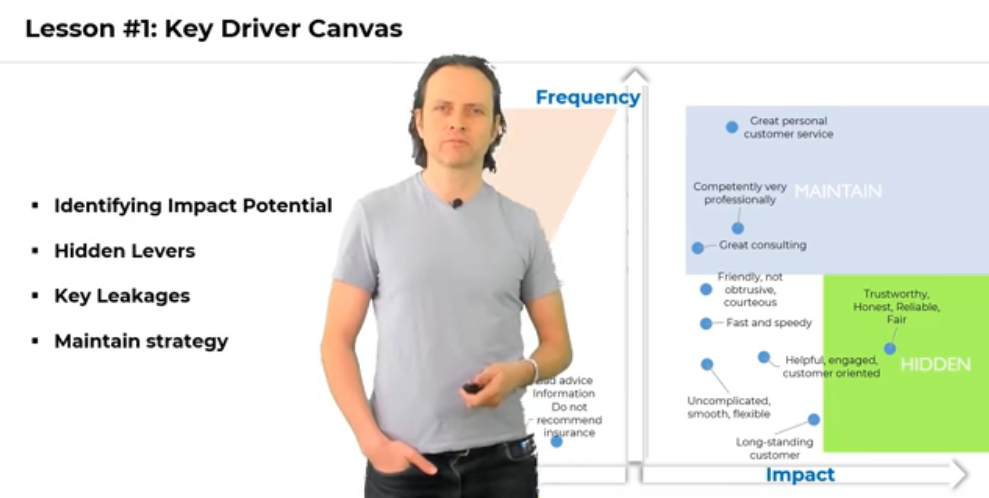
In the above key driver canvas, we have two dimensions:
The first one is the impact of the different topics that people are mentioning. It can be a positive impact or a negative impact.
The second one is the frequency that describes how often something is mentioned.
You can categorize these dimensions into three buckets or fields to arrive at a certain recommendation.
The first field has topics that have high impact but low frequency. These topics should be approved. So, this field is called a hidden lever because it has a frequency that is not often mentioned. The other fields are also essential but have a high frequency.
The second field is termed as Maintain in the above canvas. The outcome of this field is to maintain where you are good at, but improve where you have room for improvement.
The third field is the red zone in the above canvas. It is the other room for improvement, and we call it linkages. It has topics that are often mentioned and have a high negative impact. So, there exists a tradeoff as a cup of persons are mentioning something that is heavily negative. However, they should be mentioning that thing that has more importance.
In short, we need to follow the below steps to gain insights from a key driver canvas:
Identifying Impact Potential – We need to identify the impact of the potential i-e., dimension mentioned on the x-axis.
Hidden Levers – We first address the hidden levers of the key driver canvas.
Key Leakages – We need to identify the key leakages in our red zone.
Maintain Strategy – We need to maintain our strategy where we are good at it.
When you go into discussion with any organization, you arrive at the question: What do we do now to improve our services? It is because customer service has a significant impact on an organization’s success. It’s a sign of bad customer service if the customer retention and loyalty levels are low.
So, there are multiple ways you can adopt to improve your service, and you need to actually perform the action to translate the topics into possible actions.
The actions that you need to perform are:
Jot down the actions that increase or decrease the frequencies.
Evaluate the actions based on:
Cost – Cost determines whether you can quickly implement the action. Easy here means you have all the necessary resources to carry out the action, and the outcome of the exercise is pretty sure.
Ease – You can easily determine how to perform the action successfully if you determine the cost in the above step.
Impact on other topics – You need to determine the impact of cost on other topics to take proper actions to improve your service.
Integrate preferred action into the label of the dashboard. That’s an option, but it’s pretty interesting if you have excellent service and not enough people mention it. So, you need to do monthly training, and it’s advantageous to integrate your recommendations right into the dashboard for internal use.
You can derive the recommendation from simple ease of impact metrics. For instance, you can categorize your actions as:
Easy
Not Easy
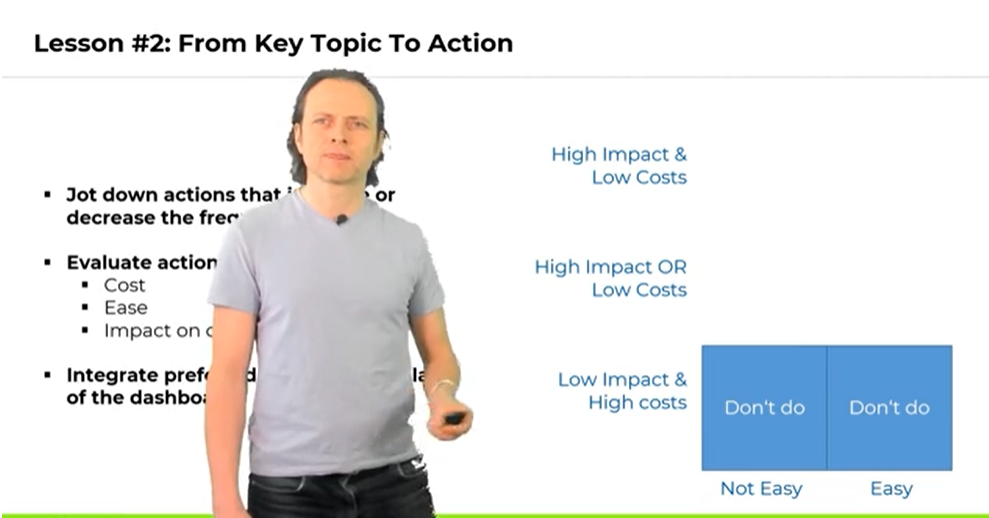
There are three situations associated with the above actions. They are:
The actions have low impact AND high costs.
The actions have a high impact OR low costs.
The actions have a high impact AND low costs.
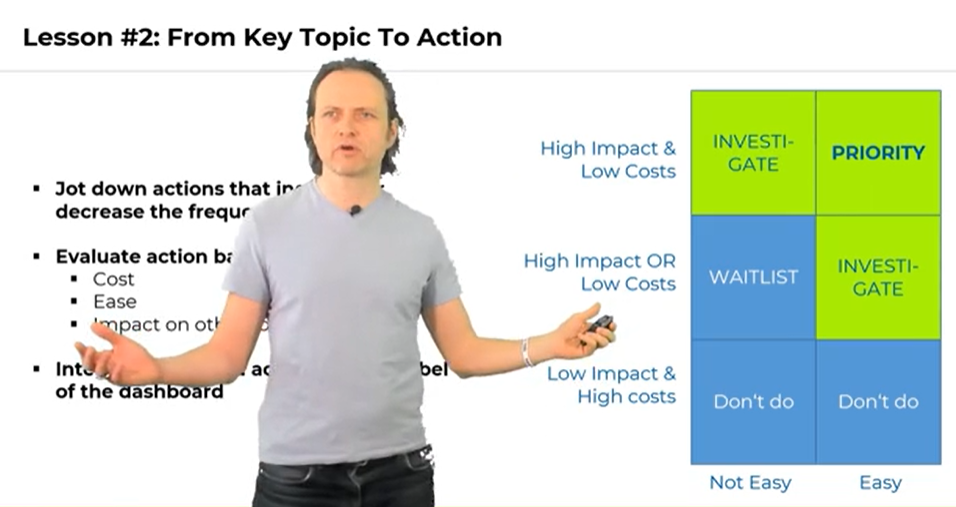
The above figure demonstrates when the actions have low impact AND high costs, do not categorize them.
When the actions have high impact OR low costs, put them on the WAITLIST if it’s not easy to categorize them. However, if it sounds easy, you need to INVESTIGATE, as shown by the above figure.
There are things that have a high impact AND low costs. If they are not easy, it still really makes sense to INVESTIGATE them. On the other hand, if something has a high impact, low cost, and is easy, that’s your PRIORITY.So, that’s the easiest way to get improvements, and we can integrate this into the dashboard as well.
Keep Yourself Updated
On the Latest Indepth Thought-Leadership Articles From Frank Buckler
So far, we have discussed the terms dashboarding, prediction, and prescription related to the key driver canvas. The driver canvas is the primary tool to understand the impact of different topics and their related frequencies. We categorized the dimensions into three fields, namely:
Hidden
Maintain
Linkages
Further, we discussed the necessary actions we need to perform for the translation of our topics. We categorized the actions as Easy and Not Easy and associated three situations with them that are:
Low Impact & High Costs
High Impact OR Low Costs
High Impact & Low Costs
So, we can improve our services and customer satisfaction by deriving valuable insights from our data.


