


CX.AI -Experience the new generation of CX Insights

Founder of CX-AI.com and CEO of Success Drivers
// Pioneering Causal AI for Insights since 2001 //
Author, Speaker, Father of two, a huge Metallica fan.
Author: Frank Buckler, Ph.D.
Published on: November 30, 2021 * 9 min read
There are unlimited ways to deal with data. There are even endless ways to set up a neural network it’s easy to get hung up on complexity. Actually, most data scientists hang up themselves in “local minima” – this is data science slang for a “sub-optimal solution”.
Lost in complexity, it’s easy to lose business outcomes out of sight.
Only if business leaders know what they really need, they can manage data science wisely.
These are the three challenges on which both need to become clear about
Here we go.
Introducing the Starway of Truth concept to understand the difference between data, facts, and truth

FREE for all client-side Insights professionals.
We ship your hardcopy to USA, CA, UK, GER, FR, IT, and ESP.
The stairway of truth starts where most people believe ends: Facts.
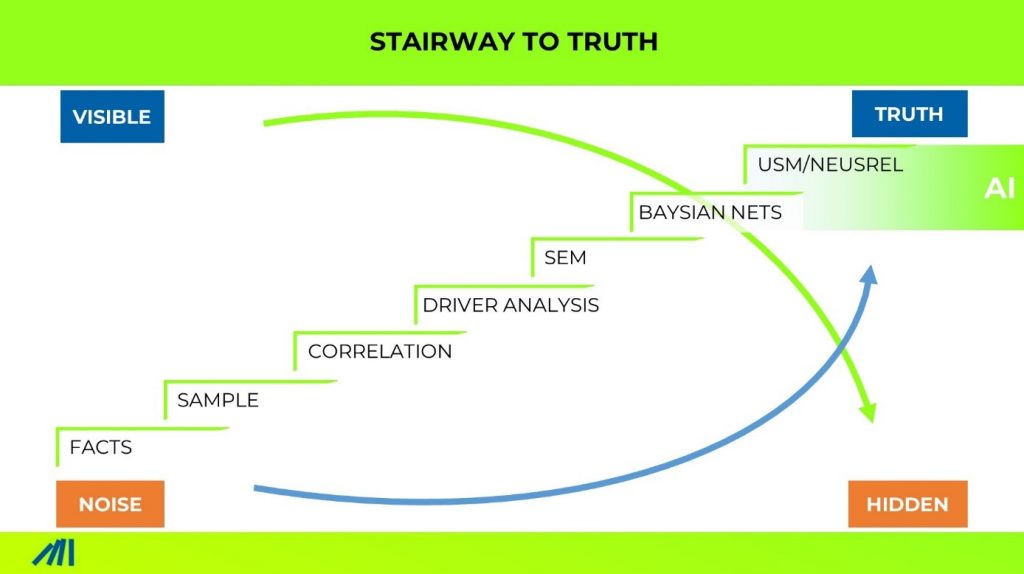
1. Facts
If you see that a plane has crashed in the news, you learn one thing: it’s dangerous to fly. 42% of people are anxious about flying, while 2% have a clinical disorder.
This is a fact but not the truth. Flying is by a factor 100.000 safer than driving a car.
When US bombers came back in world war two, the army analyzed where the bombers got hit and applied ammunition.
They acted on facts, but the initiative was useless because the analysis did not uncover the truth.
It’s impossible to understand why bombers do not come back without analyzing those who don’t come back.
In the same way, it’s impossible to understand why customers churn if you only analyze churners. It could be that churners and customers complain about the same thing.
2. Sample
What it takes instead is always a representative sample selection of facts. Facts are just particular snapshots from the truth, like a pixel out of a picture. It might be true. But it, alone, is meaningless.
In 1936, one of the most extensive poll surveys made it to the news. 2.4 million US Americans had been surveyed over the telephone. The prediction was overwhelming. Roosevelt will be the apparent loser with only 40% of the votes.
Finally, Roosevelt won with nearly 60%. How could polling fail so miserably?
The sample was not representative. At that time, telephone owners had more fiscal means. This correlated with the likelihood to vote for democrats.
Just a sample of pixels can paint a picture. But if pixels are drawn just from one side of the picture, you are likely to read a different “truth”.
3. Correlation
The journey to truth does not end at a well-sampled “picture”. Why? Ask yourself, what do business leaders really want to learn?
What’s more interesting?: “What is your precise market share?” or “how can you increase market share?”
The first question asks for an aggregated picture from facts.
The second asks for an invisible insight that must be inferred from facts. It is the question of what causes outcomes.
“Age correlates with buying lottery tickets” – From this correlation, many lottery businesses still conclude today that older people are more receptive to playing the lottery.
The intuitive method of learning on causes is the correlation. It is what humans do day in day out. It works well in environments where effects are following shortly after the cause and when at the same time, there is just one cause that is changing.
It often works well in engineering, craftsmanship, and administrations.
It works miserably for anything complex. Marketing is complex, Sales is complex, HR is complex.
“Complex” means that many things influence results. Even worse, the effects are heavily time lags.
Back to the lottery. The truth is that younger people are more likely to start buying lottery tickets. Why then are older more often playing? Purchasing a lottery ticket is a habit. Habits form over time (=age). This is amplified with the experience of winning, which again is a function of time.
4. Modeling
To fight spurious correlation, science developed multivariate modeling. The simplest form is a multivariate regression.
The idea: if many things influence at the same time, you need to look at all possible drivers at the same time to single out the individual contribution.
The limitations of conventional multivariate statistical methods are that it relies on rigid assumptions, such as
Sure, many advancements had been developed, but always you needed to know the specificity upfront. You need to know what kind of nonlinearity are what is interacting with what and how.
No surprise that this turned out to be highly impractical. Businesses get challenges and need to solve them within weeks, not years.
5. Causal Modeling
It turns out that the majority of business questions concern the causes of success.
When you want to drive business impact, you need to search for causal truth. Science, Academia, Statistics, and Data Science shy away from “causality” like a cat from freshwater.
Because you can not finally prove causality, they feel safer neglecting it. They can ignore it as they are not measured with business impact.
All conventional modeling shares a further fundamental flaw: the belief in the input-output logic. This only measures direct, not indirect, causal impact (best case).
Causal modeling uses a network of effects, not just input versus output. Further, it provides methods to test the causal direction.
6. Causal AI
Causal AI is now combining Causal Modeling with Machine Learning. This has huge consequence on the power of the insights. It eliminates all those limitations that modeling always had.
Equiped with machine learning, causal modeling becomes much more manageable and thus more practical.
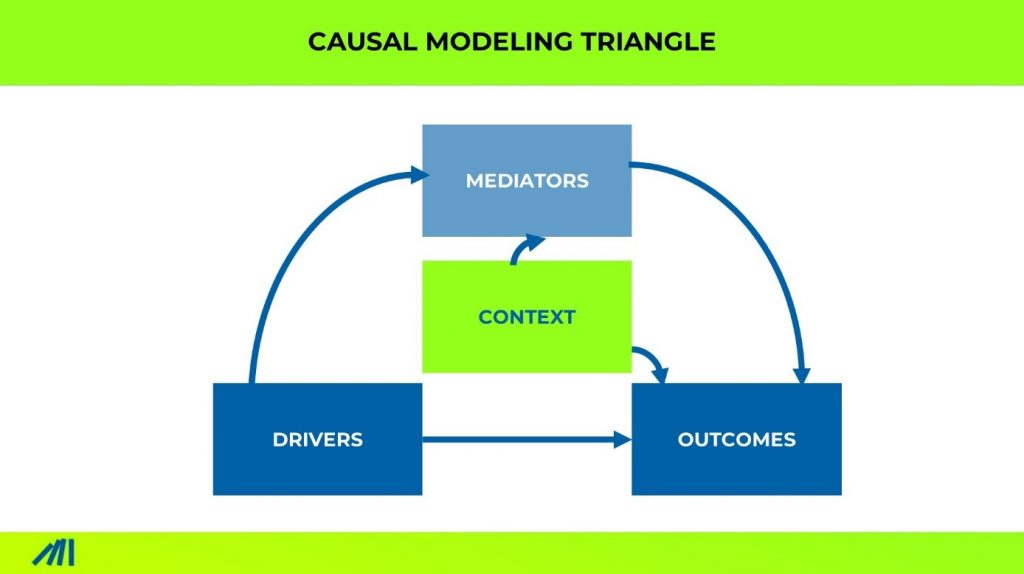
The causal insights triangle gives you the framework for how you build your model.
Let’s go thru each component and illustrate it with marketing mix modeling (MMM).
First, define what measures the desired outcomes. In MMM this would be the sales figures per day or week.
Then collect on a blank sheet what drives and influences those outcomes. This list can be bucket into three parts.
First, there are the drivers. In MMM this would be the spendings per marketing channel in a particular day or week. Drivers are variables that are independent of other variables in the set.
Second, are the mediators. In MMM, this would be the brand awareness or share of consideration set of a given week or month.
Mediators are variables that drive outcomes but also are influenced by drivers.
Third, are context variables. In MMM this would be the power of the creative to drive impact, the type of creative, the region at hand, the demographics profile of the region at hand, etc.
Context variables are moderating context factors that you may not be able to influence but impact how the model works.
The good thing is that you don’t need to know how those variables influence others. You can even use any type of data, as long as it has numbers.
With the selection of data and the categorization into the 4 buckets, you have infused your prior knowledge about causal directions into the model.
The rest is up for causal machine learning to find out.
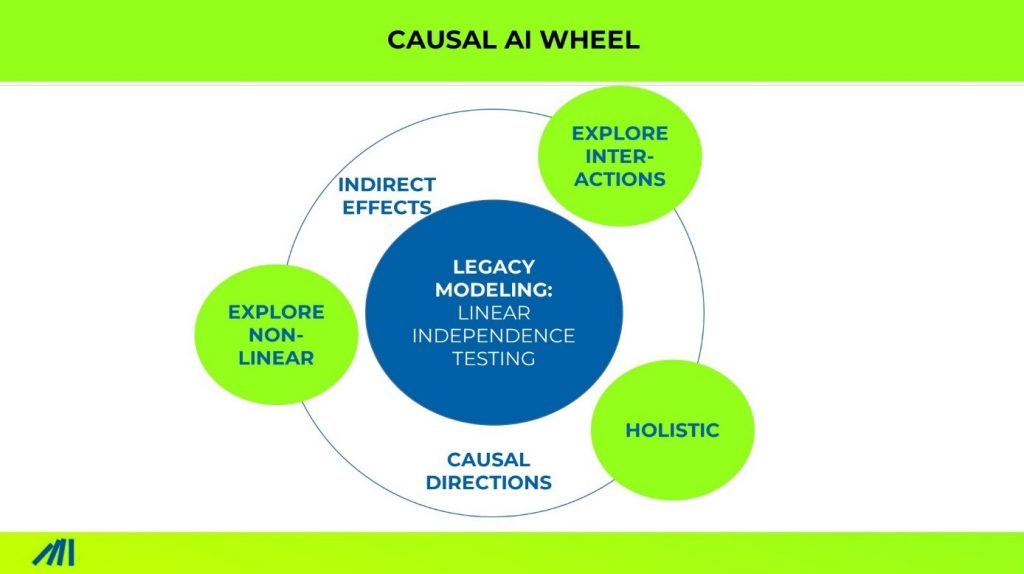
The concept of the Causal AI Weel illustrates why it’s not enough to use conventional causal modeling techniques.
Three quick examples illustrate the need:
Unknown Nonlinearity: A pharma company found it drives sales to give product samples to physicians. But with causal machine learning, we found that providing too many samples will REDUCE sales. After the fact: of course too many samples substitute prescriptions.
Unknown Interactions: In CPG, purchase intention for new products correlates zero with future success. But with causal machine learning, we found that it takes five other success factors to be true at the SAME time.
Unknown Confounders: Many companies see that the NPS rating correlates zero with future fiscal impact or churn. At an insurance brand, this was because more critical customers segments (have perse lower ratings) will buy even more, ones they are loyal. This unlying effect can be considered when integrating segments or demographic information into the modeling.
Here is in a nutshell how machine learning separates from conventional modeling:
Hold a book into the room. The floors’ two-dimension symbolize your two drivers, and the height of each point of the book stands for the outcome. The steepness of the two angles of the book represents the parameters of your modeling. The process tries to fits the book’s plane into space. This attempts to approximate the data points that are like stars in the room’s 3-dimensional space.
Machine learning does the same, but it uses a flexible book or hyperplane. It’s like a tissue or a book made of kneading. It can be formed in a way to match the data points better.
The fewer data points you have, the more rigid and less flexible it gets to avoid overfitting.
This flexibility solves a lot of problems.
Legacy techniques instead are restricted by
With machine learning now, we can explore previously unknown nonlinearities and previously unknown interactions.
We can even now combine ANY quantitative data into one model. This capability eliminates confounder risks and will improve the likelihood that findings are indeed causal.

As a marketing leader, you don’t need to know the methodological solution. But you need to ask the right questions and be careful not to get wrapped into plausible-sounding storytelling.
Here are the questions you can ask:
Someone presents you:
| You can ask
|
| Facts as proof for something | How do we know these facts are representative of the truth and not just exceptions? |
| Descriptive statistics about a representative sample of facts | How do we know that our conclusion will really influence desired outcomes? |
Comparing winner vs. losers or other kinds of correlation analysis | How do you know this is not a spurious correlation? |
| Driver analysis outcome | How can we make the model more realistic esp. by considering indirect effects – such as brand, changing attitudes and other long-term effects? |
| Driver or SEM model | How can we avoid confounder risk? (if external context influences drivers AND outcomes, it will screw results) |
| Driver, SEM, Bayesian nets results | How can we make sure results are not screwed by things we do not know of, such as nonlinearities or interactions? |
| Responds: “that’s not possible.” | I read this article from Frank from Success Drivers. He wrote it is possible. Shall we ask him? |
As a marketing leader, you have the responsibility. Data scientists are just consultants. When there is no impact, they do not care much. You do.
Like naïve patience that runs at risk of getting unnecessary treatments. It’s not the doctor’s life that is at stake.
In a complex world, it’s not enough to check results based on plausibility. It’s easy to build a plausible story from random data. Plausibility is simply not a good indicator of truth.
Instead, challenge data science and challenge marketing science to “think causal”. Challenge them to use Machine Learning to help you learn from data instead of just testing made-up hypotheses.
Here is a good read for you if the topic interests you further. We send you the hard copy book free of charge if you are an enterprise client.
Stay curious and …
… reach out to me with questions
Each month I share a well-researched standpoint around CX, Insights and Analytics in my newsletter.
+4000 insights professionals read this bi-weekly for a reason.
I’d love you to join.
“It’s short, sweet, and practical.”