


Founder of CX-AI.com and CEO of Success Drivers
// Pioneering Causal AI for Insights since 2001 //
Author, Speaker, Father of two, a huge Metallica fan.
Author: Frank Buckler, Ph.D.
Published on: September 14, 2021 * 9 min read
Driver modeling is needed to distill predictive insights. But the researchers struggle when they use out-of-the-box key driver analysis like linear regression. Not everything seems to make sense, and often positive topics get negative comments.
There is a reason for this. In this blog, I will discuss the limitations of simplistic driver modeling and will guide you on how to find a method that complies with the richness of reality. This will lead you to more meaningful impact parameters and a double predictive power of insights.

FREE for all client-side Insights professionals.
We ship your hardcopy to USA, CA, UK, GER, FR, IT, and ESP.
Let’s talk about nonlinearities because conventional regression is simply a linear regression which is a commonly used type of predictive analysis. The overall target of regression is to determine two things:
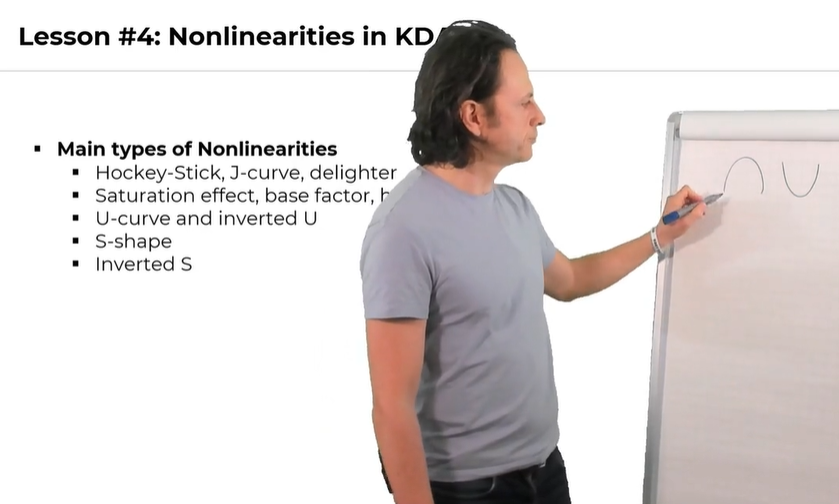
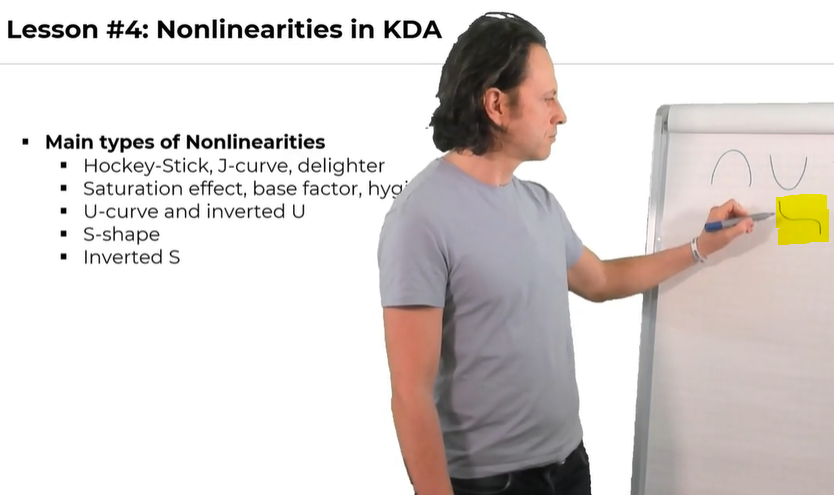
On the contrary, nonlinearity indicates a relationship between a dependent and an independent variable that is not predictable from a straight line. There are many forms of nonlinearities, among which the following are the main types:


As there are different types of nonlinearities, how do we know what kind of nonlinearity we have in playing here? So, the answer is to use a method that finds a doubt. There are two types of techniques that we can use to identify nonlinearities, and they are:
Let’s look at the limitations of both techniques.
The Limitation of Parameterized Regression – You hear the statistics or modeling experts say that 90-95% of the day, they use parameterized statistics to identify nonlinearities. They aim to have a formula (like a regression formula) to build nonlinearities. But the problem is that you need to know which kind of nonlinearity you have and which variables have this. So, this is the limitation of conventional or parameterized statistics for which it is impractical and not useful for businesses.
The Limitation of Shapley Value Regression – This technique also has some severe limits. It basically slices a data space into three to five slices, and results are very much different where you put the slice because it is not suitable for a larger number of variables.
The use of Shapley Value Regression is recommended to up to ten drivers. But, in CX, when we have codebooks with 50 or more categories, it is not recommended.
Machine Learning As a Universal Key Driver Analysis – This is where machine learning comes into play. It is a kind of universal regression that produces an outcome like a regression, but the formula is not predefined. It’s because machine learning builds a formula based on the data.
It is adaptive and can learn which formula best fits the given input towards the output. That’s why it is a competitive differentiator for many enterprises as it gives them a view of trends in business operational patterns and customer behavior.
With the help of the below figure, we can visualize machine learning:

What we see here is regression. It puts the fixed plane into the data space and finds the parameter which best fits the data.

So, this is machine learning. It is a flexible plane or a tissue wrapped around the data that best predicts the outcome (target variable).

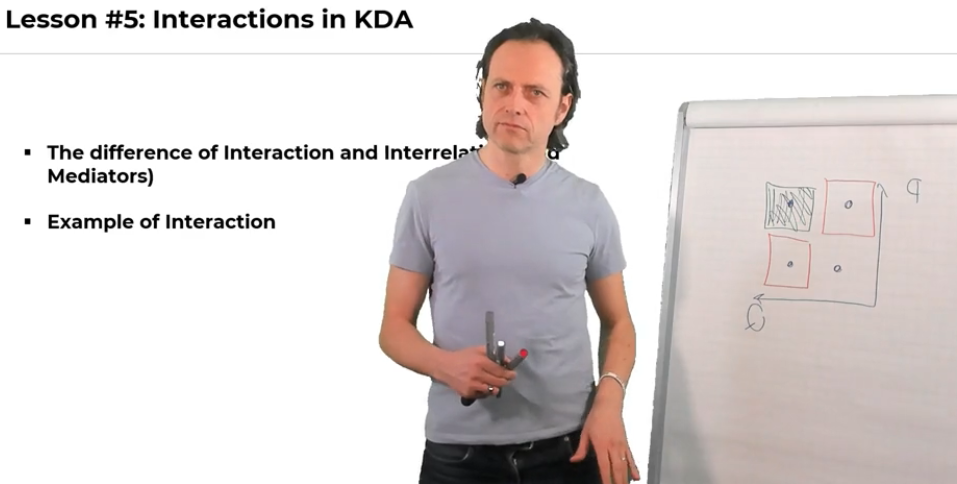
Data interactions are simple things, and we can view them as varied moody nonlinearities. They are different from interrelations, but firstly, we need to know:
We can define interaction as the situation in which two or more objects act upon each other to produce a new effect. However, interrelation can be defined as the manner in which two things can be associated. Interaction implies no causal sequence. However, mediation implies a causal sequence among three variables X to M to Y i-e., independent variable causes the mediator, and the mediator causes the dependent variable.
The difference between Interaction and Interrelation – Most often, people confuse interaction with interrelation. For instance, when they mean friendliness influences surface perception and this influences loyalty, they say that friendliness and loyalty interact with each other.
However, they don’t interact. They influence each other. So, this is an interrelation – an indirect effect towards loyalty.
Example of an Interaction – Let me give you an example of an interaction. Let’s assume that we have two drivers. One driver is quantity plotted on the x-axis, and the other one is price plotted on the y-axis, as shown in the figure below:
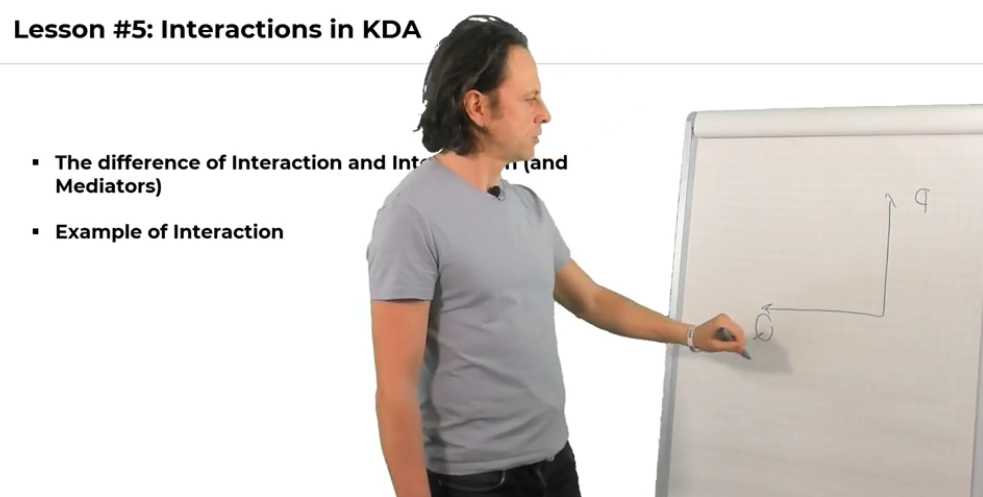
So, now we have four possibilities, and they are as:
In this scenario, where can you see an interaction? The interaction would be that you will only see people really being loyal when they are satisfied with the quality as well as the price. In short, we can see an interaction when the above-mentioned fourth possibility is satisfied.
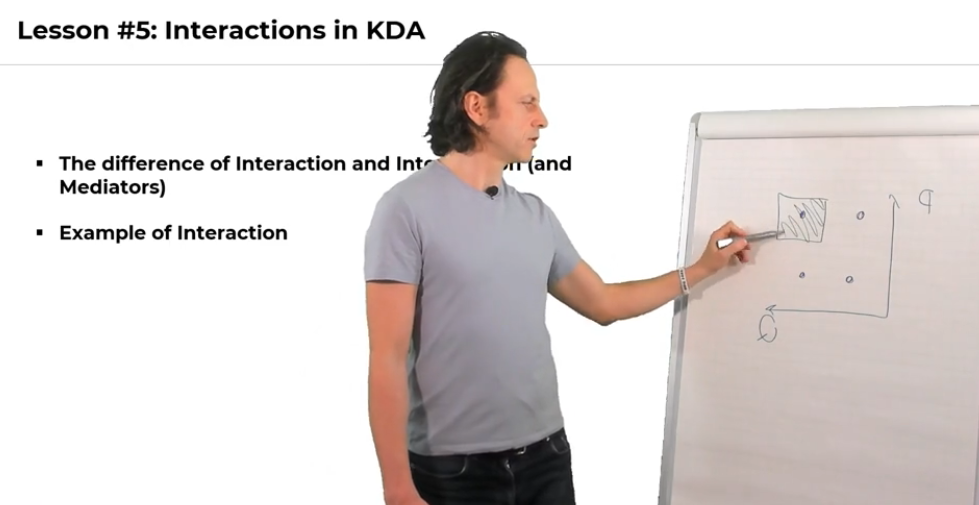
So, this is an interaction because the importance of the quality depends on the impact of the quality i-e., price. It means there is no individual importance of quality. There must be a good price as well. Both together deliver a good customer experience. So, the interaction is when there is no such thing as individual importance as it is moderated by another factor.
The interesting thing is that you can think of a different interaction as well. For instance, there are people who praise only the quality or the price, but not both. They are either the quality buyers or the price buyers. They can not be loyal to both quality and price as they have mixed perceptions, and they believe that high quality can not necessarily have a high price. Also, there are markets where this is the case that you can not have both at the same time.
So, this is an interaction too because you can have good customers with low quality. It depends on what the price is doing. The people loyal to only price or quality represent the exclusive OR logic, and the ones loyal to both denote the AND logic. So, only if the quantity or the price is given, the exclusive OR is either quality or price.
How to Handle Interaction – So, the interactions are possible, but the problem is that we don’t know the upfront. The ways to handle interactions are:
Machine Learning – So, machine learning helps you in handling interactions by finding them out of the data.
Mediators in the CX Context – Do you know what mediators are in key driver analysis? A mediator is an intermediary variable or the driver for an outcome. For instance, it is a driver for likelihood to recommend, but it’s also an outcome of other drivers. Let’s suppose if you have great service as a category, great service is an outcome for friendliness, but both could be drivers too.
So, great service is basically a higher-level category. There are other intermediary variables as well, such as sentiment.
Sentiment – It is a typical intermediary variable that measures the tonality of the verbatims. Tonality is a result of different categories because depending on the category, they have positive or negative meanings, or they are filled with emotional or rational words. So, they all have a very different tonality along with a different rational meaning.
As we discussed different mediators in customer experience models, we must know:
Why do we need to include them?
Ultimate Use of Mediators – The reason to use mediators is simple.
Measure the True Causal Impact – You use them to measure the true causal impact of your drivers because if you just do the driver analysis, which is a regression approach, it will only measure the direct effects. But, if the drivers have interrelations with each other, you need to accommodate them.
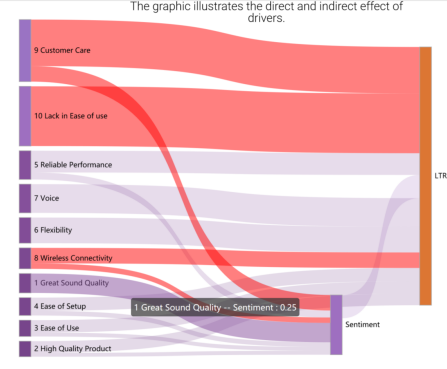
Consider the above graph that demonstrates the direct and indirect effects of drivers. Here, Great Sound Quality has no direct effect, but it’s still important. Do you know why? Because it is a very emotional variable, and any information of impact is also measured by the sentiment variable.
Understanding the true meaning of category – So, there is an indirect effect, and to understand the full effect of the driver, you need to model the direct and indirect effects. It not only helps you identify the true impact, but also helps you understand the true meaning. For instance, in the above-mentioned Great Sound example, you learned that people don’t mean the frequency spectrum is great. But, they mean they enjoy the music they are listening to. So, you really need to understand the actual meaning.
There’s another example as well. We did an exercise for a company that runs out flats, and customers wanted to know how we can improve the loyalty? One of the key drivers was the location of the flats. And, it turned out that the great location was dependent on many different factors. For instance, one of them was gardening. A great garden around the trees or a little park very much influences someone’s perception of a good location. So, you need to understand the nature of the category.
Statistical Methods – Given below are some software packages that can help you measure the indirect effects and enable you to integrate the mediators. They are as:
Universal Structure Modeling (e.g., NEUSREL)
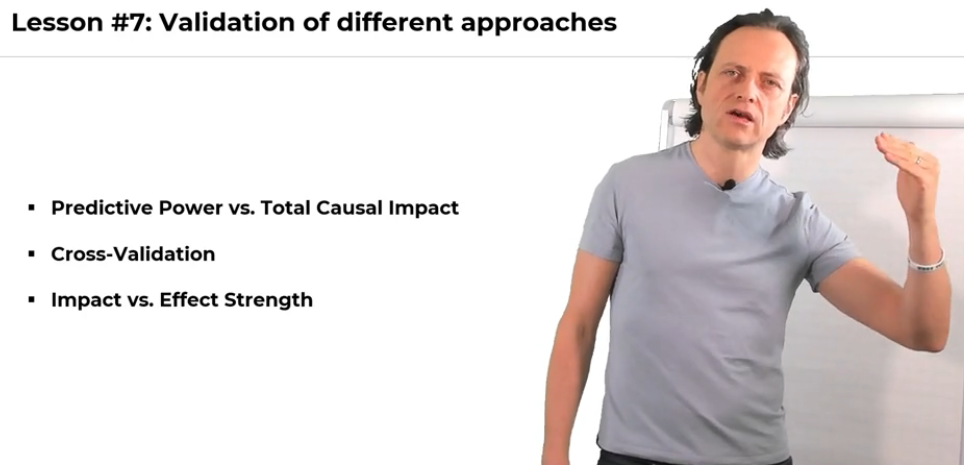
In this section, let’s talk about how to validate different approaches.
Predictive Power vs. Total Causal Impact – There are two important uses of multiple regression i-e.,
The aim of the predictive analysis is to develop a formula that makes predictions about the dependent variable based on the observed values of the independent variables. However, in causal analysis, the independent variables are regarded as causes of the dependent variable.
The predictive power is measured by the R2 of the driver analysis. But be aware that the R2
and the predictive power only measures the validity of the direct pass to the direct causal impact. It does not measure the importance and the role of the indirect effects. You need to look at the R2 of any variable that has drivers. In the causal context, there are intermediary variables like sentiment as well as the final outcome. Therefore, if you need to fully understand the network, you have to look at all of those outcomes.
Cross Validation – It is a useful sampling technique for assessing the effectiveness of your model. It tries to check for overfitting when you have a small dataset, but a large number of drivers. So, it’s good to use machine learning approaches like cross validation to check out how large the overfitting radius is so that we can minimize it.
There is another resampling technique known as Jackknife. It takes your dataset and splits it into a number of different (for instance, ten) pieces. You simply take out one piece at one time and predict the part that you’ve taken out. So, you can use cross validation methodology to calculate the predictive power of the unseen data.
Impact vs. Effect Strength – You know that impact is the influence of an action or a phenomenon, whereas the effect is the consequence or outcome of a phenomenon. In short, impact refers to how the consequence of some action is going to affect someone or something. However, the effect only refers to the consequences.
You can measure the impact in terms of how big the effect is. For instance, how much will the rating of the NPS improve if the driver is improved by 10%? But it sounds so easy when it comes to interactions because if the impact of a driver depends on another driver, you will need to simulate both at the same time. On the other hand, the effect strength actually simulates what will happen with the predictive power if we get rid of a variable. This way, it measures the overall importance of a variable in a model even if it has a low impact.
It is a must to use key driver analysis, and it’s always good to use regression type of analysis. But, there are certain tricks and traits that actually improve the predictive power of those key drivers by a hundred percent.
For instance, we can improve the predictive power if we:
And this can be done using machine learning which is the best and the most practical way to improve the predictive power. Further, we talked about validation in key driver analysis that helps mitigate model overfitting and calculates the predictive power of unseen data.
P.S. Would you like to get the complete & interactive FREE CX Measurement Guidance for your business in 2021?
Simply subscribe on the free “CX ANALYTICS MASTERS” course below and enjoy the above-mentioned training guidance in its Class # 1.
“Solves key challenges in CX analytics”
IMPRINT
Our Group: www.Success-Drivers.com
Privacy Policy
Copyright © 2021. All rights reserved.
FOLLOW CX.AI
![]()
![]()
![]()