The vague term “context” is about something very concrete: a causal effect relationship. All business decisions are based on it. They are based on assumptions about causal impact relationships. “If I do X, then Y will happen”. Discovering, exploring and validating these “relationships” is what (consciously or unconsciously) most market research is about.
But whether we can trust a statement about a context is indicated by the product of the following three criteria:
Completeness (C for Complete): How many other possible reasons and conditions are there that also have an influence on the target variable, but have not been considered in the analysis so far. One can express this with a subjective probability (an a priori probability in the Bayesian sense): 0.8 for “pretty complete”, rather 0.2 for “actually most of it is missing”, or 0.5 “the most important is in there”).
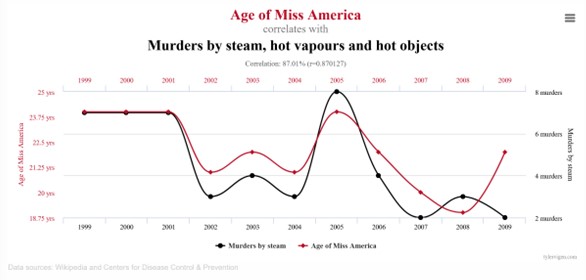
But why is completeness so important? Example: shoe size has some predictive power for career success because, for various reasons, men climb the career ladder higher on average and have larger feet. If one does not include gender in the analysis, there is a great risk of falling for spurious effects. Causal researchers call this “the confounder problem.” Confounders are unconsidered variables that influence cause and effect at the same time. Even today, most driver models are calculated with “only a handful” of variables, and the risk of spurious findings is therefore high.
The issue of representativeness logically belongs to completeness. This is because one either ensures a representative sample (which is more or less impossible) and controls for biasing factors, or one measures the factors that influence the relationships being measured (demographics, shopper types, etc.) and integrates them into the multivariable analysis of the relationships. I’ll go into this topic in detail once in another post (tentative title: “AI saves representativeness”).
Correct Direction of Action (D for Directed correctly): How sure can we be that A is cause of B and not vice versa? There one can often fall back on previous knowledge, possibly one has longitudinal data. Otherwise statistical methods of “d-separation” (e.g. PC-algorithm) have to be applied. So again it is about the questions how the subjective probability is: rather 0.9 for “well, that is well documented” or 0.5 for “well, that could be so or so”?
Predictive Power (P for Prognostic): How much variance in the effected variable does the cause explain? Measures of effect size measure the absolute proportion of the variance explained that is made possible by a variable. Nobel Prize winner G. Granger once stated in his research: In a complete (C), properly directed (D) model, the explanatory power of a variable proves its direct causal influence.
If any of the three variables C, D or P hapens, the evidence for the relationship is very thin. This is because all three aspects are interdependent. Prognostic power without completeness or the right direction is worthless.
Mathematically, all three values can be multiplicatively combined. If one is small, the product is very small:
Evidence = C x D x P
This Evidence is a proven tool in Bayesian information theory, as well as a viable and useful value for making a judgment for a context.


